What Causes CPU Pressure?
If
there was an easy answer to the question of what causes CPU pressure,
an administrator’s job would be a lot easier. Let’s look at a list of
common items that cause pressure:
Poorly written applications
Memory-intensive services
Servers not sized to support the applications
Too many processes on the server
Servers not having enough RAM
As you can see by the preceding list, a variety of issues can cause CPU pressure.
Throttling
Throttling an
application or process is one way of keeping server resources available
and not allowing the server to become unresponsive. The term throttling
means limiting the amount of server resources a particular process or
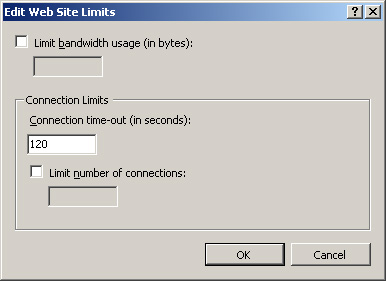
resource can use. For example, IIS 7.0 offers various ways to throttle
resources—from bandwidth to connection time-outs and limits. If your
server hosts multiple Web sites, you can throttle the number of
connections one Web site receives. This would help keep it from using
too many connections or server resources and also prevent other Web
sites hosted on the server from being affected. Figure 1 shows the available options in IIS 7.0 that you can throttle. This can be done a per–Web site basis.
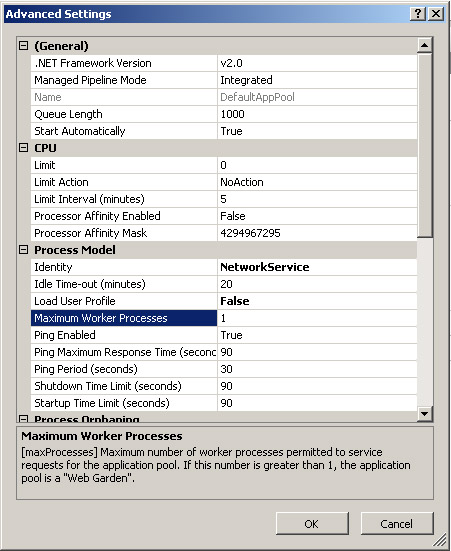
IIS 7.0 offers
several ways using application pool limits to throttle resources. You
can set limits on worker process CPU settings, Rapid Fail Protection,
Recycling, and several settings in the Process model section located in
application pool settings.
Caching
provides one of the better ways to enhance your application’s
performance. There are also ways to throttle how much of the server
resources are used. Locking down how much RAM caching is allowed to use
can impact the performance gains your application experiences.
You can use application
pool options to help lower CPU usage so that your higher impact sites
have resources available. This is one example of how you could control
resources on your server and maximize application performance.
CPU Counters to Monitor
See Table 1
for a list of common counters that help identify which processes and
how much of the server resources are being used when your IIS 7.0 server
is experiencing high CPU conditions.
Table 1. CPU Counters to Measure
| Counter Name | Description |
|---|
| Processor(_Total)\% Interrupt Time | The
time the processor spends receiving and servicing hardware interrupts
during sample intervals. This value is an indirect indicator of the
activity of devices that generate interrupts, such as the system clock,
the mouse, disk drivers, data communication lines, network interface
cards, and other peripheral devices. These devices normally interrupt
the processor when they have completed a task or require attention.
Normal thread execution is suspended during interrupts. Most system
clocks interrupt the processor every 10 milliseconds, creating a
background of interrupt activity. This counter displays the average busy
time as a percentage of the sample time. |
| Processor(_Total)\% Privileged Time | The
time the processor spends receiving and servicing hardware interrupts
during sample intervals. This value is an indirect indicator of the
activity of devices that generate interrupts, such as the system clock,
the mouse, disk drivers, data communication lines, network interface
cards, and other peripheral devices. These devices normally interrupt
the processor when they have completed a task or require attention.
Normal thread execution is suspended during interrupts. Most system
clocks interrupt the processor every 10 milliseconds, creating a
background of interrupt activity. This counter displays the average busy
time as a percentage of the sample time. |
| Processor(_Total)\% Processor Time | The
percentage of elapsed time that the processor spends to execute a
non-idle thread. It is calculated by measuring the percentage of time
that the processor spends executing the idle thread and then subtracting
that value from 100%. (Each processor has an idle thread that consumes
cycles when no other threads are ready to run.) This counter is the
primary indicator of processor activity and displays the average
percentage of busy time observed during the sample interval. It should
be noted that the accounting calculation of whether or not the processor
is idle is performed at an internal sampling interval of the system
clock (10 ms). On today’s fast processors, % Processor Time can
therefore underestimate the processor utilization, as the processor may
be spending a lot of time servicing threads between the system clock
sampling intervals. Workload-based timer applications are one example of
applications that are more likely to be measured inaccurately, as
timers are signaled just after the sample is taken. |
| Processor(_Total)\% User Time | The
percentage of elapsed time the processor spends in user mode. User mode
is a restricted processing mode designed for applications, environment
subsystems, and integral subsystems. The alternative, privileged
(kernel) mode, is designed for operating system components, and it
allows direct access to hardware and all memory. The operating system
switches application threads to privileged mode to access operating
system services. This counter displays the average busy time as a
percentage of the sample time. |
| System\Context Switches/sec | The
combined rate at which all processors on the computer are switched from
one thread to another. Context switches occur when a running thread
voluntarily relinquishes the processor, is preempted by a higher
priority ready thread, or switches between user-mode and privileged
(kernel) mode to use an Executive or subsystem service. It is the sum of
Thread\\Context Switches/sec for all threads running on all processors
in the computer and is measured in numbers of switches. There are
context switch counters on the System and Thread objects. This counter
displays the difference between the values observed in the last two
samples, divided by the duration of the sample interval. |
| System\System Calls/sec | The
combined rate of calls to operating system service routines by all
processes running on the computer. These routines perform all of the
basic scheduling and synchronization of activities on the computer and
provide access to nongraphic devices, memory management, and namespace
management. This counter displays the difference between the values
observed in the last two samples, divided by the duration of the sample
interval. |
Reliability
and Performance Monitor counters can help you establish a baseline for
your server and can help you understand the number of resources used
during normal and peak times. When an issue arises, you can use the
server’s baseline information and then compare the statistics collected
to help identify the issue.
Using
Reliability and Performance Monitor counters provides a lot of
information. When used effectively, using these counters will help
isolate and resolve a performance problem.
Impact of Constraints
Constraining the
CPU resources on a server can impact how your application performs. This
applies only when you are putting constraints on your application. When
you do so, it impacts performance—one application frees up resources
for another application.
Countermeasures
One example of how IIS
7.0 can help counter high CPU usage is by implementing Web gardens. Web
gardens are an available feature on worker processes that help spread
the workload across multiple processes. See Figure 2.
One
thing to keep in mind is that Web gardens do not work on applications
requiring stateful sessions. What does that mean? If you have a caching
application, the variables will be cached in each application pool
process and will not be shared among other processes. The reason for
this is that each process has its own copy of the application state, so
values are independent of other worker processes and would not match
across other processes in the Web garden.
Consider this example of
when to use Web gardens. Steve at Contoso Ltd. has an application that
is hitting the 2 GB x86 process limit and is crashing. The application
does not use session state, so it is a candidate for enabling Web
gardens. After enabling Web gardens, Steve is able to spread the
application load across multiple worker processes, preventing the
application from crashing.
Let’s take a look
at another example from Steve at Contoso Ltd. He also has a database
process that experiences latency. From time to time, this causes the
application pool to crash. To help with performance and tuning of the
application, Steve adds processes to give the application multiple
processes accessing the resource (in this case, it’s a database).