To view a log generated by FRT, use Windows Explorer to browse to the FRT log file location and open the W3SVCn folder, where n
is the site ID. Each event is logged in an individual XML file. The XML
files use a style sheet named Freb.xsl that formats the XML log file,
making it much easier to read and to navigate through. Simply
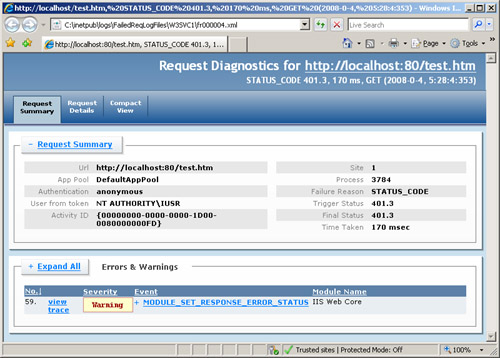
double-click the Frxxxxxx.xml file you want to view. You’ll see a summary page like the one shown in Figure 1.
Caution By
default, you will not be able to view FRT log files on Windows Server
2008 because of the Internet Explorer enhanced security configuration
(ESC). You might be prompted to add about:internet to the list of
trusted sites. If after doing so you still are unable to view the log
file on Windows Server 2008, you need to disable ESC in Server Manager.
Disabling ESC weakens server security in regards to viewing Web-based
content. Therefore, it’s better to view the FRT log files on a client
machine. Otherwise, immediately re-enable ESC when you have finished
viewing the log files. |
|
So
you’ve configured FRT, but you cannot find your log files. Now you’ve
got to troubleshoot the troubleshooting feature, eh? Let’s start with
the basics:
1. | Make sure that you’ve enabled
FRT at the site level. If you are managing a site but are not
administering the IIS server, remember that although you can define
failure conditions and what to trace in your web.config files, you still
need to have the IIS administrator enable FRT for your site. In IIS
Manager, click on the Web site in question and in the Actions pane,
select Failed Request Tracing in the Configure section. This will bring
up a dialog box for enabling FRT as well as for setting the directory to
log to and the maximum number of files.
| 2. | Make
sure the worker process identity has FULL CONTROL access to the
directory in question. This is because the worker process writes out the
log files under its own identity, creates the W3SVCn directory (where n is your site ID), and deletes old files.
| 3. | Check
the Event Viewer\Windows Logs\Application event log for events from the
Microsoft-Windows-IIS-W3SVC-WP source. The most common errors are
typically going to be permissions errors. Other possible errors can
include:
- Bad configuration
The event will indicate what aspect of the configuration is incorrect,
and this aspect will need to be fixed before that failure condition will
be triggered.
- FileSystem is full
We’re writing log files, and XML files at that. Make sure there’s space
on the volume for writing the log. If you hit this error on the system
drive, though, problems with FRT are probably not the biggest of your
worries!
|
This should help you figure out why you’re not getting FRT log files.
Eric Deily
Senior Program Manager Lead
|
If
you select the Request Details tab at the top of the page, you can
choose from among several formats for examining the details:
Complete Request Trace Shows each step in the trace, event by event. Filter Notifications
Shows all events generated by filters in the trace, enabling you to see
each ISAPI filter that your request went through, the time it spent in
the filter, and any possible changes to the request or response (such as
the addition or removal of headers) that the filter made. Module Notifications
Shows each module that the request went through (in order), including
the notification for which the request went through the module as well
as the time it spent in the module. Performance View
Shows time spent in subactivities (such as authentication or going
through ISAPI filters) and is designed to help you find where your
request is spending most of its time. Authentication Authorization Shows events related to authentication and authorization in the trace. ASP.NET Page Traces Shows events in the trace raised through Trace.Write() and Trace.Warn()
calls. When page tracing is enabled on your ASPX page, it will also
capture the internally raised events for each ASP.NET page event. Custom Module Traces Shows events generated by managed modules using the System.Diagnostics API (via System.Diagnostics.TraceSource() calls).
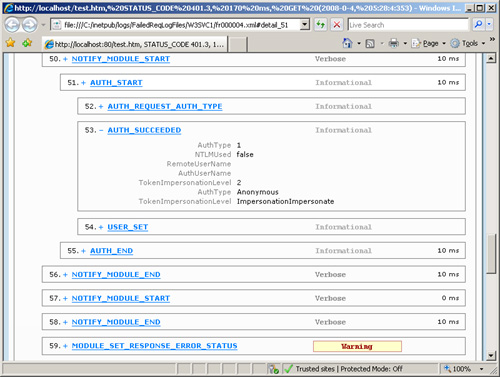
You can click the plus sign (+) next to any event to expand the event’s details. Figure 2
shows a section of the Complete Trace view, indicating that the user
was successfully authenticated before IIS set the error status. This
indicates a problem with permissions, rather than authentication, which
is exactly how we set up the scenario ). Notice the events are nested and that the trace reports a duration in milliseconds for each step in the trace.
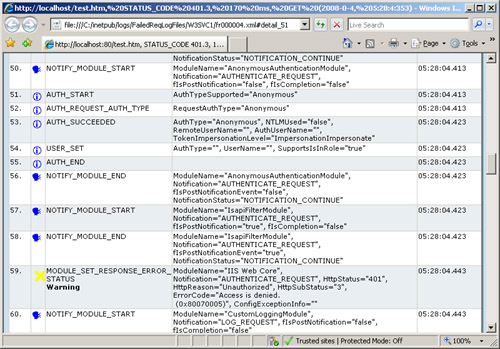
If you select the Compact
View tab at the top of the page, you can easily scroll through the full
details for all events, as shown in Figure 3.
You
can use the FRT trace logs to pinpoint the source of problems. For
example, if you are troubleshooting a request that has a long response
time, select Performance View on the Request Details tab to quickly find
which module (or modules) or ISAPI filters in the request pipeline
might be responsible for the delay.
|
One of my favorite
features in IIS 7.0 is something we originally called FREB, which stood
for Failed Request Event Buffering. It now bears the friendlier name
Failed Request Tracing (FRT), but folks around here still sometimes call
it FREB. FRT enables you to configure IIS to “watch for” certain error
conditions and provide you detailed trace information about the request.
This makes it much easier to diagnose failures than in past versions of
IIS, especially those hard-to-reproduce issues that seem to only happen
at 3 A.M. when you should be sleeping. IIS will not only log all of the
IIS trace events we’ve sprinkled through our code but also ASP.NET
trace events and even your own page trace events! It is one powerful
feature.
Do you see requests
slow down over time, or do they hang unfinished? Simply configure FRT
to watch for requests that exceed a given time-out threshold, and you’ll
get detailed information on everything that happened during the request
up to the time limit. Using that information, you should be better able
to pinpoint where the hang-up is happening.
Are you seeing random
401, 404, or Server 500 errors? IIS is infamous for returning these
standard error messages for lots of different reasons. With IIS 7.0,
detailed errors provide much more information to you if you’re on the
localhost, but if you want to know which component returned the error,
or what happened in sequence before the error, you have to turn to FRT.
When looking at an FRT
trace log, by default you see the Request Summary tab, which shows basic
information about the request, as well as all error and warning events
that were found in the trace log. This is a great way to zero in on
which event might have caused your error. By clicking View Trace, you
can actually zoom in on the entire hierarchy of events that occurred—in
order—during the request and see the event you clicked on in context.
Bill Staples
IIS Product Unit Manager
|
|