Using Tools and Utilities
This
section briefly explains a core set of troubleshooting tools and
utilities. Use them to systematically examine the many components that
can be at fault when a Web site or application is not responding as it
should.
Become well-versed
in using these utilities. When you are faced with a challenging issue,
your experience will not only help you efficiently work through the
problem but will also guide you in your understanding of the full range
of possible causes to be explored.
Note
The IIS 6 Diagnostics Toolkit (which includes AuthDiag, DebugDiag, and SSL Diag) does not work with IIS 7.0, but refer to http://www.iis.net for possible updates to this valuable troubleshooting tool. |
Table 1
lists the tools and utilities covered in detail later in this article.
The table briefly describes when and how you might apply these tools.
Table 1. When to Use Troubleshooting Tools
| Tool or Utility | Applicability | Security or Performance Considerations for Production System |
|---|
| net start | Check whether or not a service is started and start it if it is stopped | None |
| sc query | Check whether or not a service is started | None |
| ping | Check for basic network connectivity | None |
| PortCheck | Check for connectivity through a specific port on the server | None |
| tasklist | Find the PID for a service; use the PID to check status with netstat | None |
| netstat | List
all listening ports with their protocol, local and foreign address,
state, and PID (look for the PID you found with tasklist) | None |
| WFetch 1.4 | Send
and receive actual headers and requests without interference from a
user-friendly browser; view the raw request and response | Poses a security risk because of stored passwords and test certificates |
| Appcmd | List and start sites and application pools; check for correct network bindings | None |
| Process Monitor | Monitor file system, registry, process, thread, and dynamic-link library (DLL) activity; monitor worker processes | Turn off when not in use |
| IIS Manager | Examine currently running worker processes and requests | None |
| Event Viewer | Check for error events in Application and System logs | None |
| Failed Request Tracing (FRT) | Generate trace logs, especially for errors that are intermittent or hard to reproduce | Minimize possible performance impact by narrowly limiting the scope of monitored requests |
| Reliability and Performance Monitor | Check overall system performance; identify suspect processes when server appears to hang | Turn off when not in use |
| Network Monitor | Capture network packets and diagnose Transmission Control Protocol (TCP) session data | Turn off when not in use |
Using net start and sc query
Note
Explore
the sections in this article on net start, ping, and the PortCheck tool
when confronted with a 503 error code or a “Page cannot be displayed”
error. |
You can quickly check which services are running on a machine by using the following command at a command prompt.
All active services
will be listed. In particular, to accept requests, the server must be
running the Windows Process Activation Service (WAS) and the World Wide
Web Publishing Service (W3SVC). You can quickly check (and start if
necessary) the W3SVC service, for example, as follows.
If the service was
not started, it will start. Otherwise, a message will indicate that the
service has already been started. W3SVC depends on WAS. If you try to
stop WAS when W3SVC is running, you will be asked to confirm that you
want to stop both services. Likewise, if you try to start W3SVC when WAS
is stopped, the command will automatically (although silently) start
WAS.
If you want to check
the status of a service and not start it if it is stopped, you can
alternatively use the following command, where serviceName is the name of the service you want to check.
For example, the output from running sc query W3SVC looks like this.
SERVICE_NAME: w3svc
        TYPE                : 20 WIN32_SHARE_PROCESS
        STATE               : 4 RUNNING
                                 (STOPPABLE, NOT_PAUSABLE, ACCEPTS_SHUTDOWN)
        WIN32_EXIT_CODE     : 0  (0x0)
        SERVICE_EXIT_CODE   : 0  (0x0)
        CHECKPOINT          : 0x0
        WAIT_HINT           : 0x0
Using ping
Note
Refer to the information in this section when you are confronted with a 503 error code or a “Page cannot be displayed” error. |
You can rule out basic
network issues by pinging the server from the client. First try pinging
the URL host name to make sure it is being correctly resolved to an IP
address. Use the ping command line tool from a command prompt, as in the
following example.
The output should show an
appropriate IP address. If it does not, make sure the client’s Domain
Name System (DNS) server is working properly. Also check to see if the
client has a hosts file that might be interfering with proper IP address
resolution. Assuming IP address resolution is not a problem, if you
can’t ping the server’s IP address itself, there could be a problem with
the network connection, either at the client or the server end. But do
check to make sure firewall settings on the client aren’t preventing the
connection.
Using PortCheck
If you’re unable to ping a
server, it could be because the server’s firewall is rejecting the
connection, or the service isn’t listening on the required port. The
PortCheck tool can check Transmision Control Protocol (TCP) connectivity
for a specific port at the IP address in question. The tool provides a
detailed breakdown of the different connectivity issues you might be
facing.
Use the PortCheck tool from the command line to check for connectivity through a specific port on a URL as follows.
portcheck www.contoso.com 80
Or you can specify the IP address, like this.
portcheck 192.168.1.101 80
Using tasklist and netstat
If you suspect problems
with a service or process listening on a port, you can list all services
and their process IDs (PIDs) by entering the following command at the
command prompt.
The output, showing PID 564 for the W3SVC and WAS services, for example, looks like this.
Image Name                     PID Services
========================= ======== ============
System Idle Process              0 N/A
System                           4 N/A
smss.exe                       360 N/A
...
svchost.exe                    564 W3SVC, WAS
Use the output from
tasklist to find the PID for the service you are troubleshooting. Next,
to list all listening ports with their protocol, local and foreign
address, state, and PID, enter the following command at the command
prompt.
Look for the PID that
you located with tasklist in the netstat output and check the address
and state, or look for processes that are listening on a port you are
interested in. The output, showing PID 4 listening on port 80, for
example, looks like this.
Active Connections

  Proto  Local Address        Foreign Address     State          PID
  TCP    0.0.0.0:80           0.0.0.0:0           LISTENING      4
  TCP    0.0.0.0:88           0.0.0.0:0           LISTENING      560
  TCP    0.0.0.0:135          0.0.0.0:0           LISTENING      844
  TCP    0.0.0.0:389          0.0.0.0:0           LISTENING      560
...
Using WFetch 1.4
Note
WFetch 1.4 is included in the IIS 6 Diagnostics Toolkit. You can download WFetch 1.4 separately at the following location: http://www.iis.net/go/1307. |
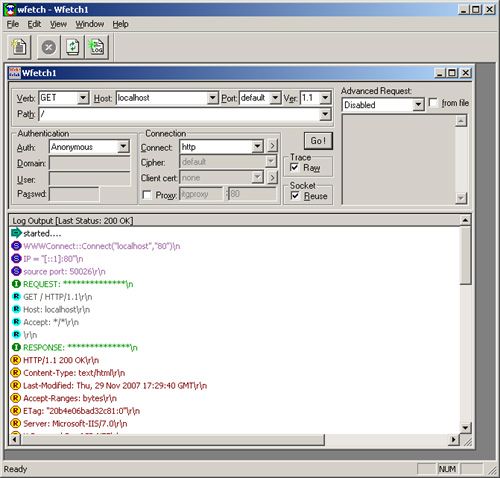
Sometimes the
error reporting that the browser provides can partially obscure the
symptoms of a problem. You can bypass the typical browser’s
user-friendly packaging by using WFetch, which is essentially a browser
with no enhancements. WFetch lets you see the raw data sent between
browser and server, so it’s ideal for testing authentication issues or
looking at custom headers in both the request and response packets.
Caution
Because
WFetch enables you to store passwords and manipulate test security
certificates, WFetch has the potential to expose your site to security
risks. Therefore, Microsoft recommends that this tool be used only in
testing, not in a production environment. |
To run WFetch 1.4 (on
an x86 system for this example), execute WFetch 1.4 from the IIS
Diagnostics (32bit)\WFetch 1.4 program group. Figure 1
shows the WFetch 1.4 user interface with log output after requesting
the default Web page on localhost. You can use the interface to specify
an HTTP verb (GET, HEAD, PUT, DELETE, TRACE, POST, OPTIONS),
the host, the port, the HTTP version, and the path, as well as
authentication and connection types. For complicated scenarios, you can
manually add portions of a request in the Advanced Request section or
have WFetch read part of the request from a file.
Note
The
file format for help files included with the current release of the IIS
6 Diagnostics Toolkit is not supported on Microsoft Windows Vista or
Windows Server 2008. Use online help instead or install WinHlp32.exe to
use the help files. See the following Knowledge Base article for more
information and a link to the WinHlp32.exe download location: http://support.microsoft.com/kb/917607. |
Using Appcmd
If a site isn’t running, or
if the network bindings for the site are misconfigured because of an
error in your IIS configuration or in the site definition, the IIS
server won’t be able to receive requests for that site. You can use
Appcmd to quickly check that a site is running and that its network
bindings are correctly configured. Enter the following command at the
command prompt.
If the IIS
configuration is OK, the site definition’s bindings are listed, along
with the current state (Started, Stopped, or Unknown). Check that the
bindings make sense. If the site is not started, a configuration error
might be preventing IIS from starting the site or the application pool.
You can start a site by using Appcmd as follows.
AppCmd start site sitename
Similarly, you can check whether or not an application pool is started by using this command.
If necessary, start the application pool by using this command.
AppCmd start apppool poolname
Using Process Monitor
Process Monitor
lets you monitor the file system, registry, processes, threads, and
DLLs. It replaces and extends two tools used in earlier versions of IIS:
Filemon and Regmon. Process Monitor is a sophisticated tool that
provides detailed system information along with searching, filters, and
simultaneous file logging to help you sort through the wealth of data.
You can examine the process data in real time, or you can capture and
review it later.
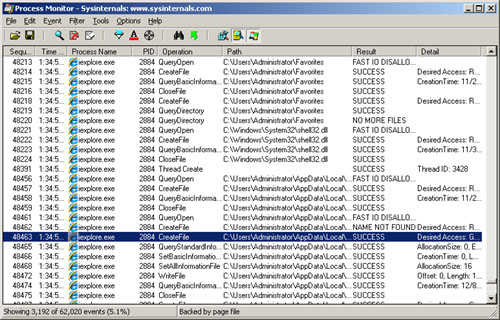
To start Process Monitor, run Procmon.exe from its installation location. Figure 2
shows the Process Monitor window displaying a small portion of the
operations that take place when a user browses a site. You can toggle
the display of operations related to registry activity, to file system
activity, and to process/thread activity. You can filter the operations
according to an extensive list of categories and values. Process Monitor
also lets you search the list and jump directly to an object involved
in the operation, for example, a temporary file or registry key.
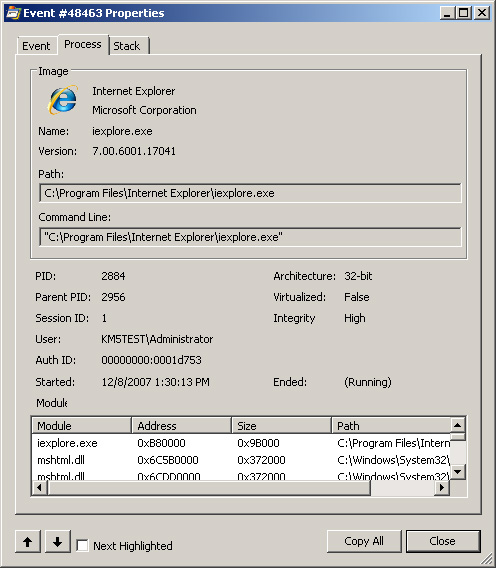
Double-clicking an
operation displays properties for the operation, from which you can view
information about the event, the process (as shown in Figure 3), or the stack.
You can view summary reports as well as a tree view of processes, as shown in Figure 4.
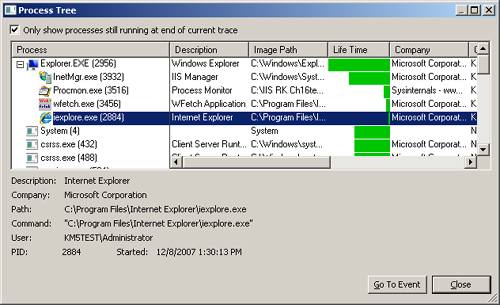
You
can use Process Monitor to monitor your worker processes (filter for
“Process Name is w3wp.exe”). To check which application pool the worker
processes serve, use IIS Manager as explained in the next section to
look at the Worker Processes list and the list of active requests. Doing
so lets you peer into the worker process to see running requests and in
what stage those requests are, as well as what appDomains are loaded
into that process.
You can also use
Process Monitor to examine system-wide details for a series of events
when your troubleshooting efforts take you outside the scope of
information captured by IIS-specific tools such as FRT.
Note
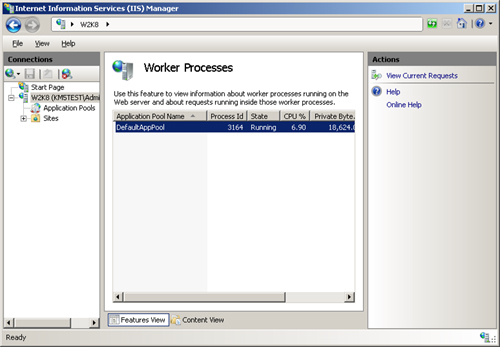
Using IIS Manager
IIS Manager uses the
Runtime State and Control API (RSCA) to provide a viewport onto
currently running worker processes and any requests running under those
processes. In IIS Manager, select the server in the tree control and
then scroll down in the central pane and double-click Worker Processes
in the IIS group. IIS Manager displays currently running worker
processes, as shown in Figure 5.
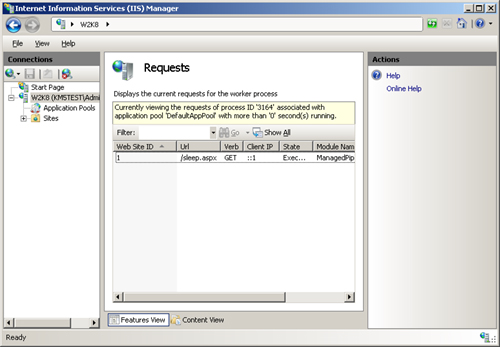
Select
the worker process you want to investigate and click View Current
Requests in the Actions pane to display the list of current requests for
that worker process, as shown in Figure 6.
Knowing what worker
processes and requests are currently executing (the “requests in
flight”) can help you resolve slow request responses when the culprit is
an unrelated request that’s excessively consuming system resources. You
might also find that an application interferes with other applications
in the same application pool and decide to separate the application into
its own application pool. Or you could create an FRT rule for the
currently executing requests and see where they’re all blocking and what
happened to those requests prior to the block.
Note
ou can programmatically access RSCA through the WMI provider or through managed code and the Microsoft.Web.Administration namespace, which exposes the following information for a request through the WorkerProcess class. (GUID is the unique request ID that is also emitted when tracing is turned on for the request.) | GUID | Site | ClientIPAddress | CurrentModule | | ConnectionID | LocalIPAddress | TimeElapsed | TimeInModule | | Verb | LocalPort | PipelineState | | | URL | HostName | TimeInState | |
For examples of accessing RSCA via code, go to http://www.iis.net and search for “How to Access IIS7 RSCA Data,” then click on the article with the same name.
|
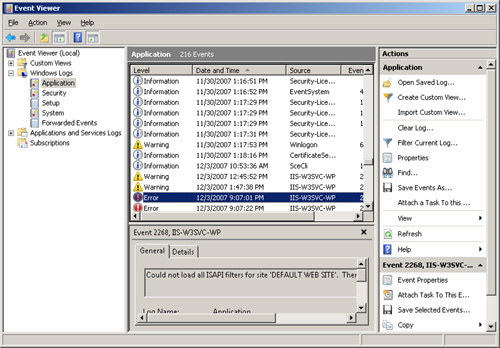
Using Event Viewer
You can use Event Viewer
to check why an application pool has been stopped or cannot be started.
To start Event Viewer, launch Event Viewer from the Administrative Tools
program group. Alternatively, from the Run text box, type eventvwr. In the tree, expand Windows Logs and then select Application. You can filter the list of events by event source.
Errors the IIS-W3SVC-WP source generated, as shown in Figure 7,
indicate that the worker process started but failed during
initialization. This might happen, for example, if the configuration
section is invalid, if a module failed to load, or if a module failed to
initialize. You can double-click an event to see details about it.
Also
select the System node under Windows Logs. Errors generated by the
IIS-W3SVC-WP or WAS source in the System log indicate that WAS could not
start the worker process. This might be caused, for example, by a
problem in the configuration, by a problem with the application pool
identity credentials, by exceeding the number of worker processes
allowed, or by running out of some other resource.
An error in the System
log might also be caused by a bug in custom application code. WAS will
disable an application pool if an application in the pool triggers Rapid
Fail Protection (RFP). RFP is a mechanism that IIS uses to prevent
repeated failures in a faulty application from bringing down the system.
When IIS identifies repeated worker process crashes or hangs in a given
application, RFP will shut down the entire application pool in which
the application is running.
Using FRT
Use FRT to generate trace
logs of IIS responses that violate conditions you set in the FRT
component of IIS Manager. To use FRT
most efficiently in your troubleshooting process, narrowly restrict the
FRT rules you add so that you can examine the minimal subset of URLs
that are experiencing problems.
Using Reliability and Performance Monitor
Use
Reliability and Performance Monitor to examine the overall condition of
your server. You can start Reliability and Performance from the
Administrative Tools program group. Select the Performance Monitor node
under the Monitoring Tools node in the tree. You can add and configure
counters for all aspects of the server’s performance, as shown in Figure 8.
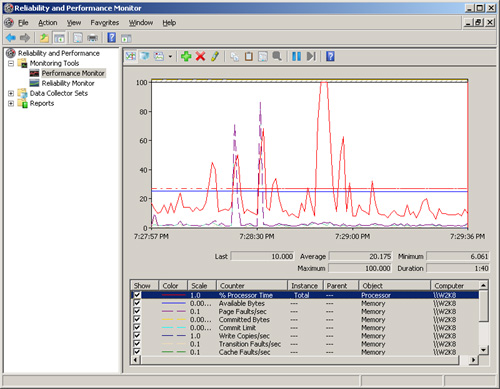
You will almost
always want to monitor Process and Thread counters such as Processor
Time and % Processor Time. When troubleshooting an ASP or ASP.NET
application, also look for the Active Server Pages counters, the various
.NET CLR counters, and the ASP.NET and ASP.NET Applications counters.
In addition, IIS 7.0 adds many new performance counters under the
groupings W3SVC_W3WP and WAS_W3WP.
Reliability and
Performance Monitor is especially useful when you are investigating a
server that appears to hang. You can save a performance log by creating a
Data Collector Set. To do so, expand the Data Collector Sets node in
the tree and then right-click the User Defined node and select New\Data
Collector Set from the context menu. To isolate the problem, analyze the
performance log in combination with a memory dump from the process that
is running on the server. You must time the memory dump to coincide
both with the hanging behavior and with a performance log that is
actively collecting data.
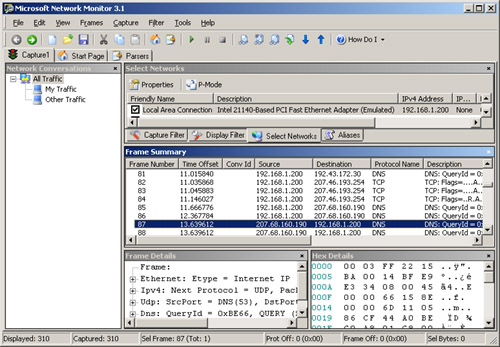
Using Network Monitor
If you need to
troubleshoot a problem that involves connectivity issues, you can use
Network Monitor to capture network packets and diagnose TCP session
data. You can start Network Monitor
3.1 from the Microsoft Network Monitor 3.1 program group. After
capturing a sequence of network packets, you can double-click a frame in
the sequence to see complete details (including the hexadecimal
contents) of the frame, as shown in Figure 9.
Note
Network Monitor 3.1 is not part of the default install for Windows Vista or Windows Server 2008. To download Network Monitor 3.1, go to http://www.microsoft.com/downloads and search for “Microsoft Network Monitor 3.1.” |