XMLA and Data Mining
To round off our
coverage of data mining development and how it compares with OLAP
development, it is important to mention that XMLA can be used for all
data mining tasks, including execution of a DMX query (of any type) or
the scripted creation of objects. As with OLAP objects, you can
right-click a mining structure or model in Management Studio’s Object
Explorer window and choose Script Mining Structure As (or Script Mining
Model As) to generate an XMLA script for its creation, deletion, or
alteration. Similarly, you can use the View Code option from the
Solution Explorer window in Visual Studio on a mining structure in an
SSAS project to reveal the XMLA script that will be executed to deploy
that mining structure to the server.
As a quick example,
the following query (contained in LeastLikelyCar.xmla in the Management
Studio sample solution) executes the same DMX query contained in
LeastLikelyCar.dmx and retrieves the result as XML:
<Execute xmlns="urn:schemas-microsoft-com:xml-analysis">
  <Command>
    <Statement>
      SELECT   TOP 250 t.FirstName, t.LastName, t.Phone,
               PredictProbability([Is Car Owner],'N') AS ProbNotCarOwner
      FROM   CarOwner_DT
      PREDICTION JOIN
        OPENQUERY([Adventure Works DW],
        'SELECT c.FirstName,c.LastName,tc.*
         FROM   vCustomerProfitability tc
          INNER JOIN dimCustomer c ON tc.CustomerKey = c.CustomerKey')
        AS t
        ON t.Gender = CarOwner_DT.Gender AND
         t.IncomeGroup = CarOwner_dt.[Income Group] AND
         t.MaritalStatus = CarOwner_dt.[Marital Status] AND
         t.Region = CarOwner_dt.Region
      ORDER BY PredictProbability([Is Car Owner],'N') DESC
    </Statement>
  </Command>
  <Properties>
    <PropertyList>
      <Catalog>Chapter20</Catalog>
    </PropertyList>
  </Properties>
</Execute>
Notice that the structure of the query is virtually identical to the XMLA script QueryCubeChapter18.xmla . The only differences are the change in database name within the <Catalog> tags and the replacement of an MDX query with a DMX query.
Unlike
QueryCubeChapter18.xmla, however, this query returns its XML data using a
very straightforward schema. Here’s an excerpt from the response
stream:
<return xmlns="urn:schemas-microsoft-com:xml-analysis">
  <root xmlns="urn:schemas-microsoft-com:xml-analysis:rowset" xmlns:xsi="http://
www.w3.org/2001/XMLSchema-instance" xmlns:xsd="http://www.w3.org/2001/XMLSchema">
    <xsd:schema...
    </xsd:schema>
    <row>
      <FirstName>Gerald</FirstName>
      <LastName>Moreno</LastName>
      <Phone>1 (11) 500 555-0189</Phone>
      <ProbNotCarOwner>7.808883911907428E-1</ProbNotCarOwner>
    </row>
    <row>
      <FirstName>Erick</FirstName>
      <LastName>Fernandez</LastName>
      <Phone>1 (11) 500 555-0117</Phone>
      <ProbNotCarOwner>7.808883911907428E-1</ProbNotCarOwner>
    </row>
    <row>
      <FirstName>Alisha</FirstName>
      <LastName>Nath</LastName>
      <Phone>1 (11) 500 555-0173</Phone>
      <ProbNotCarOwner>7.808883911907428E-1</ProbNotCarOwner>
    </row>
...
  </root>
</return>
Data Mining and Reporting Services
Once you have designed
and trained your mining models, it’s easy to display the results in a
Reporting Services report. DMX, although powerful, does lack some basic
query functionality that might be desirable for showing data mining
results. The ability to write DMX code to aggregate or group results is
notably lacking. Because you can specify an SSAS data source in
Reporting Services, you can leverage the reporting functionality,
including subtotaling and grouping, built into Reporting Services for
displaying the results of your mining models.
1. | Return to Visual Studio and create a new Reporting Services project by choosing File, New, Project or File, Add, New Project.
| 2. | In
the New Project or Add New Project dialog box that appears, select
Business Intelligence Projects from the Project Types tree view on the
left, and select Report Server Project from the Visual Studio Installed
Templates list on the right. Name the project Chapter20Reports and then click OK.
| 3. | You
should see a node labeled Chapter20Reports in Solution Explorer.
Right-click the Reports node below the Chapter20Reports node, and choose
Add, New Item. (Alternatively, you can choose Project, Add New Item or
press CTRL+SHIFT+A.)
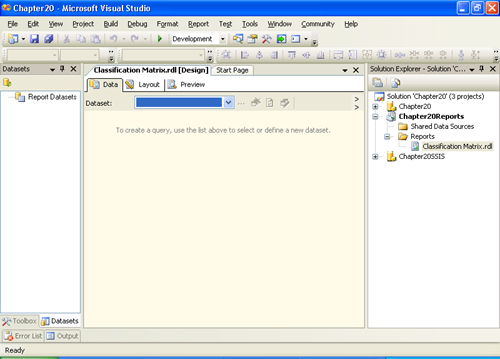
| 4. | In
the Add New Item dialog box, select Report from the set of Visual
Studio Installed Templates. Change the name of the report to Classification Matrix and click Add. Your Visual Studio window should appear similar to Figure 1.
| 5. | On the Data tab, select <New Dataset...> from the Dataset drop-down list.
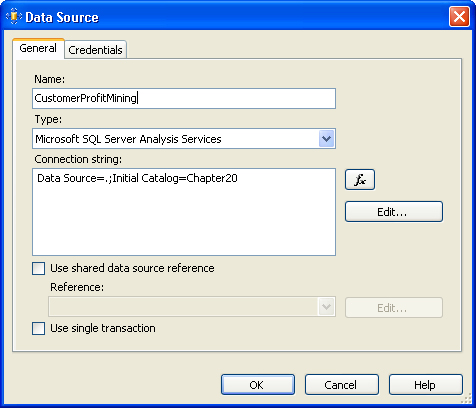
| 6. | In
the Data Source dialog box, select Microsoft SQL Server Analysis
Services from the Type drop-down list and then click the Edit button.
| 7. | In
the Connection Properties dialog box, set the Server Name to the name
of your SSAS server, and then select the Chapter20 database from the
Select or Enter a Database Name drop-down list. Click OK.
| 8. | Back in the Select the Data Source screen, change the Name to CustomerProfitMining; the settings should now appear similar to those in Figure 2.
| 9. | Click
OK to create the data source. You will see the DMX Prediction Query
designer render on the Data tab. When you specify an SSAS database as
the source for your report, Reporting Services provides a special
Analysis Services query designer, which can help you design MDX (OLAP)
or DMX (data mining) queries. Because our database has a mining
structure and no cubes, the designer defaults to its DMX mode. (Clicking
the Command Type MDX toolbar button—the fifth from the left—would allow
us to switch to the MDX designer instead.)
| 10. | On
the left of the Data tab is a mini-window labeled Mining Model; click
its Select Model button to display the Select Mining Model dialog box.
This dialog box displays a tree view of mining structures in the
database and the mining models within each.
| 11. | Expand the CustomerProfitCategory mining structure’s node, select the CustomerProfitCategory_DT model’s node, and click OK.
| 12. | Back
on the Data tab, click the Select Case Table button in the Select Input
Table mini-window to bring up the Select Table dialog box. Select the
vCustomerProfitability view and then click OK.
| 13. | Back
in the Select Input Table mini-window, click the Select Nested Table
button, select the vCustomerPurchases view in the Select Table dialog
box, and then click OK once more.
| 14. | Right-click
the Data tab’s designer surface and then choose Modify Connections. In
the resulting Modify Mappings dialog box, verify that the mappings
between the mining model and the case and nested tables are correct and
then click OK. (The Customer Key mining model column will be unmapped
and should be left as such.)
We are going to create a report that shows a classification
matrix for the CustomerProfitCategory_DT model. The classification
matrix shows the actual profit category of customers and the profit
category predicted by the Decision Trees model, along with a count of
the customers. By looking at the count of cases where the actual
category differs from the predicted category, you can get a sense of how
well the model predicts profit. In practice, we would create the
classification matrix using a test set, such as the random sample of
customers in the TestCustomers table. As
stated previously, however, we will use vCustomerProfitability, which
has the full set of individual customers in AdventureWorksDW, so that
the results are reproducible.
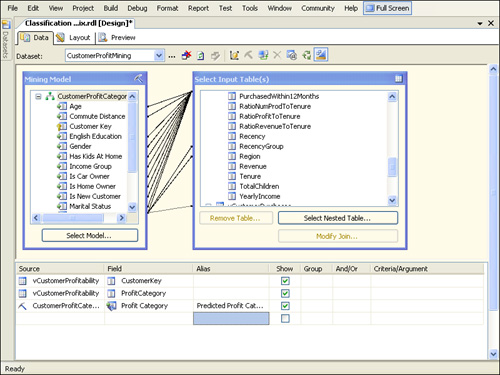
| 15. | In
the grid in the bottom half of the Design tab, select
vCustomerProfitability from the drop-down list in the first row under
the Source column. In the Field column, select the CustomerKey column.
(If it is selected by default, do nothing.) In the second row, select
vCustomerProfitability again, but this time select ProfitCategory as the
field. The predicted profit category will be determined from the
CustomerProfitCategory_DT mining model; therefore, in the third grid
row, select the CustomerProfitCategory_DT mining model as the source,
set Profit Category as the field, and then set its alias to Predicted
Profit Category. The Data tab should appear as shown in Figure 3.
| 16. | To
see the actual DMX query generated by the designer, you can deselect
the Design Mode toolbar button (first from the right) or right-click
anywhere on the Data tab and choose Query. The DMX query generated by
the designer will appear at the bottom of the Data tab. You should
recognize it as a DMX prediction query—not too dissimilar from ones we
wrote in the previous section. In fact, you could paste this query into
an empty DMX Query window in SQL Server Management Studio and execute it
there. You could also do the reverse—create a report based on the
results of one of the prediction queries from the Management Studio
Chapter20DMX project by copying the DMX statement directly into the Data
tab.
We are now ready to design the layout of the report.
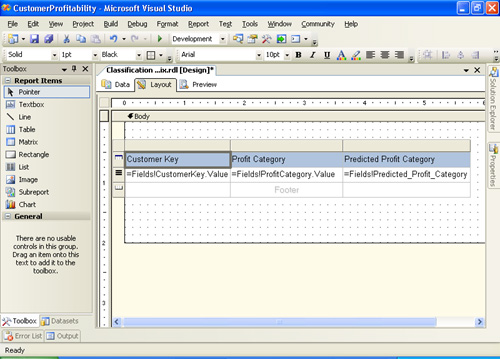
| 17. | Click
the Layout tab. Drag a table item from the Toolbox onto the Layout
pane. Right-click the leftmost cell in the Detail row, and choose
Properties. Change the Name of the text box to CustomerKey, and select =Fields!CustomerKey.Value from the Value drop-down list. Click OK.
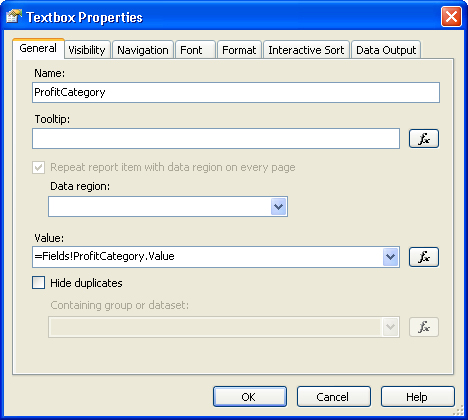
| 18. | Follow
the same steps to add the ProfitCategory field to the middle column of
the detail row and the Predicted_Profit_Category field to the right
column of the detail row, naming the text boxes ProfitCategory and
PredictedProfitCategory, respectively. Figure 4 shows the General tab of the Textbox Properties dialog box for the ProfitCategory field.
| 19. | In the Header row, type Customer Key, Profit Category, and Predicted Profit Category
above each of the corresponding cells of the Detail row. Format the
background color of the Header row and then left-align all cells in the
table. When you are finished, the Layout tab should appear similar to Figure 5.
| 20. | Click
the Preview tab to preview the report. The report lists each customer
in vCustomerProfitability along with the customer key, the actual profit
category of the customer, and the predicted profit category of the
customer.
In its current form, the report is long and unwieldy. To change
this, we must group and summarize the records in the table.
| 21. | Go
back to the Layout tab. Right-click the gray row header to the left of
the CustomerKey field on the Detail row and then choose Insert Group.
| 22. | On
the General tab of the Grouping And Sorting Properties dialog box,
select =Fields!ProfitCategory.Value in the first row and
=Fields!Predicted_Profit_Category.Value in the second row of the
Expression grid in the Group On section. Click OK.
| 23. | Back
on the Layout tab, you will see two rows added to the table: one above
the Detail row and one below the Detail row. Delete the row that was
added below the Detail row. (Select its row header and press the DELETE
key, or right-click the row header and choose Delete Rows.) Next,
right-click the middle cell below the Profit Category heading and then
choose Properties. Change the name of the text box to ProfitCategoryGroup and then select =Fields!ProfitCategory.Value from the Value drop-down list. Click OK.
| 24. | Repeat the previous step for the cell below the Predicted Profit Category heading, naming the text box PredictedProfitCategoryGroup and selecting =Fields!Customer_Profit_Category.Value from the Value drop-down list.
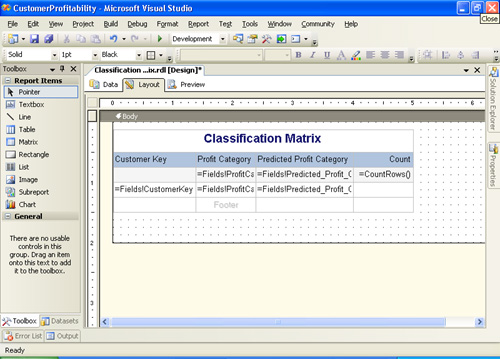
Finally, we want to add a summary measure of the records to the table.
| 25. | Right-click
the gray column header of the Predicted Profit Category column and then
choose Insert Column To The Right. Give the new column a header of Count and then type =CountRows() in the cell under the header.
| 26. | Change
the background color of the group header row so that it can be easily
identified in the report. Add a Textbox item (from the Toolbox) above
the Table object in the report, and enter the text Classification Matrix.
Stretch the text box to the full width of the report, center-align it,
and format its font and color settings so that the report appears
similar to Figure 6.
| 27. | Click
the Preview tab. Page through the report. The report is still unwieldy
and shows all the data rows. Inserting the group simply reordered the
detail rows in the table and added a row before each possible actual and
predicted profit category value pair. To fix the report so that it
displays a simple classification matrix without the customer details, we
must hide the detail rows.
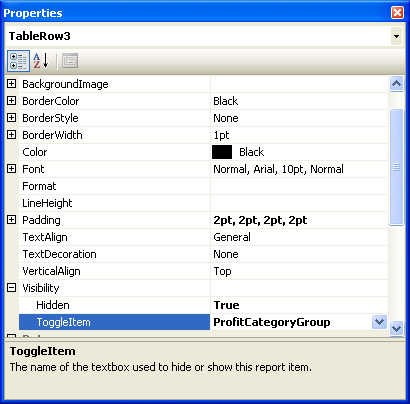
| 28. | Go
back to the Layout tab, right-click the detail row header, and then
choose Properties. Expand the Visibility property in the Properties
window by clicking its plus sign (+) icon. Set the Hidden property to
True and the ToggleItem property to ProfitCategoryGroup. The properties
should be set as shown in Figure 7.
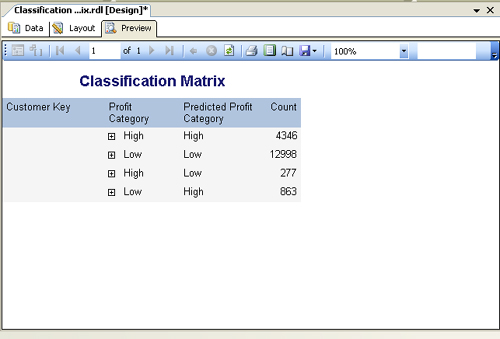
| 29. | Click the Preview tab. You now have your simple classification matrix, as shown in Figure 8.
|
The classification
matrix shows that your Decision Tree model of customer profitability
performs pretty well. The first two rows of the classification matrix,
where the predicted profit category is equal to the actual profit
category, represent the cases in which the Decision Tree model got it
right. Out of 18,484 customers (the sum of the Count column), the model
correctly predicted the profit category for 17,344 customers (4,346 plus
12,998). Click any profit category’s plus sign to toggle between
showing and hiding the detail rows.
|