7. MySQL Query Browser
The MySQL Query Browser is another of the optional GUI tools available for MySQL. Use
it to build queries and execute them in a graphical form. Result sets
are returned and displayed in a spreadsheet-like dialog. MySQL Query
Browser allows for vertical scrolling through all of the results as well
as changing the size of the columns and horizontally scrolling to better
view the data. Many users find this tool more convenient and easier to
use than the older command-line client (mysql).
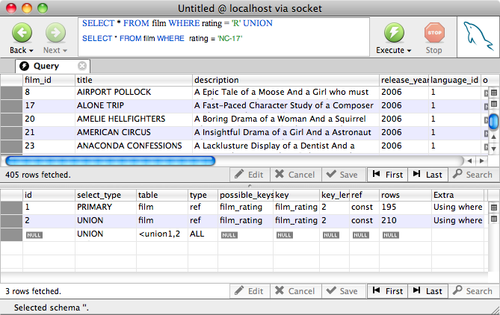
The performance-related functionality and the value added for
administrators is the graphical display of the results of the EXPLAIN command for any given query. Figure 11 shows a sample from the
sakila database.
The MySQL Query Browser example shown here should give you an
indication of the utilitarian use of the GUI. You can enter any query
and see the explanation of the query execution by first executing the
query, then selecting Explain Query from the Query menu.
Notice there are two parts to the results. The bottom part shows
the results of the EXPLAIN command as
well as the actual rows returned. You can use the scroll bars to view
more data without having to reissue the query.
What makes this a performance tuning tool is the fact that it lets
you write the query once; use the EXPLAIN feature; observe the results, then
either rewrite the query or adjust indexes; then reissue the query and
observe the changes in the GUI. And you thought query tools were for
users only—not so with this tool.
But wait, there’s more. The MySQL Query Browser has enhanced
editing tools, such as color-coding, built into the small text box shown
in Figure 11. To see all of the
advanced features and uses for the MySQL Query Browser, see the MySQL
GUI Tools documentation at http://dev.mysql.com/doc/.
Note:
If you run Windows, you can install the MySQL System Tray
Monitor, which displays an at-a-glance view of your server’s health. A
green icon means the server is running, and red means it has stopped.
You can also use the MySQL System Tray Monitor to gain quick access to
common functions, such as shutdown and launching the MySQL
Administrator or MySQL Query Browser.
8. Server Logs
If you are a seasoned Linux or Unix administrator, you are familiar with the
concepts and importance of logging. The MySQL server was born of this
same environment. Consequently, MySQL has several logs that contain
vital information about errors, events, and data changes.
This section examines the various logs in a MySQL server,
including the role each log plays in monitoring and performance
improvement. Logfiles can provide a lot of information about past events
(that’s actually the point).
There are several types of logs in the MySQL server. There are
logs for recording the SQL commands executed, long-running (slow)
queries, changes to data, and the results of the backup and restore
commands. You can turn any of the logs on or off using startup options.
Most installations have at least the error log enabled. The logs
included in the MySQL server include the following:
General query log
Slow query log
Error log
Binary log
Backup logs
The general query log, as its name implies, contains
information about what the server is doing. It contains information like
connections from clients, as well as a copy of the commands sent to the
server. As you can imagine, this log grows very quickly. Examine the
general query log whenever you are trying to diagnose client-related
errors or to determine which clients are issuing certain types of
commands.
Note:
Commands in the general query log appear in the same order in
which they were received from the clients and may
not reflect the actual order of execution.
Turn on the general query log by specifying the --log startup option. You can also specify the name of the
logfile using the --log-output
startup option. These options have dynamic variable
equivalents. For example, SET GLOBAL log_output =
FILE; sets the log output for a running server to write to a
file. Finally, you can read the values of either of these variables
using the SHOW VARIABLES
command.
The slow query log stores a copy of long-running queries. It
is in the same format as the general log, and you can control it in the
same manner with the --log-slow-queries startup option. The server variable that controls which
queries go into the slow query log is log_query_time (in seconds). You should tune
this variable to meet the expectations for your server and applications
to help track times when queries perform slower than desired. You can
send log entries to a file, a table, or both using the FILE, TABLE, or BOTH options, respectively.
The slow query log can be a very effective tool for tracking
problems with queries before the users complain. The goal, of course, is
to keep this log small or, better still, empty at all times. That is not
to say you should set the variable very high; on the contrary, you
should set it to your expectations and adjust the value as your
expectations or circumstances change.
Note:
The slave does not log slow queries. However, if you use the
--log-slow-slave-statements option,
it will write slow-running events to its slow log.
The error log contains information gathered when the MySQL
server starts or stops. It also contains the errors generated while the
server is running. The error log is your first stop when starting an
analysis of a down or impaired MySQL server. On some operating systems,
the error log can also contain a stack trace (or core dump).
You can turn the error log on or off using the --log-error startup option. The default name for the error log is the
hostname appended by the extension .err. It is saved in the base directory (the
same location as the host of the data directory).
Note:
If you start your server with --console, errors are written to standard
error output as well as to the error log.
The binary log stores all of the changes made to the data on
the server as well as statistical information about the execution of the
original command on the server.
The unique format of the binary log allows you to use the log for
incremental backups, where you store the binlog file created between
each backup. You do this by flushing and rotating the binary logs
(closing the log and opening a new log); this allows you to save a set
of changes since your last backup. This same technique lets you
perform PITR, where you restore data from a backup and apply the
binary log up to a specific point or date.
Since the binary log makes copies of every data change, it does
add a small amount of overhead to the server, but the performance
penalty is well worth the benefits.
Note:
The overhead of the binary log can be much higher depending on
your disk setup. When the binary log is turned on, there is no
concurrent commit when using the InnoDB storage engine. This can be a
concern in high-write scenarios with binary logging and InnoDB.
You turn on the binary log using the --log-bin startup option, specifying the root filename of the binary
log. The server appends a numeric sequence to the end of the filename,
allowing for automatic and manual rotations of the log. While not
normally necessary, you can also change the name of the index for the
binary logs by specifying the --log-bin-index startup option. Perform log rotations using the FLUSH LOGS command.
You can also control what is logged (inclusive logging) or what is
excluded (exclusive logging) using --binlog-do-db and --binlog-ignore-db,
respectively.
9. Third-Party Tools
There are a few third-party tools that are really quite useful. Some of the more
popular are MySAR, mytop, InnoTop, and MONyog. They
are all text-based (command-line) tools that you can run in any console
window and connect to any MySQL server reachable across the network. We
discuss each of these briefly in the following sections.
9.1. MySAR
MySAR is a system activity report that resembles the output of the
Linux sar command; thus it is a
sar command for MySQL. In this
case, MySAR accumulates the output of the SHOW STATUS,
SHOW VARIABLES, and SHOW FULL PROCESSLIST commands and stores
them in a database on the server named mysar. You
can configure the data collection in a variety of ways, including
limiting the data collected. You can delete older data in order to
continue to run MySAR indefinitely and not worry about filling up your
disk with status dumps.
MySAR is open source and licensed under the GNU Public License
version 2 (GPL v2). You can download MySAR from https://launchpad.net/mysar.
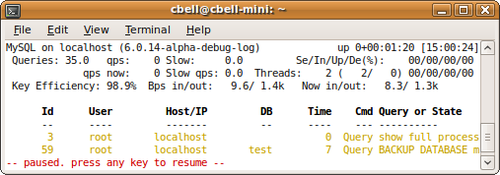
9.2. mytop
The mytop utility monitors the thread statistics and general performance
statistics of MySQL. It lists the common statistics like hostname,
version of the server, how many queries have run, the average times of
queries, total threads, and other key statistics. It mimics the
top command found in Linux. It runs
the SHOW PROCESSLIST
and SHOW STATUS
commands periodically and displays the information in a listing like
the top command. Jeremy D.
Zawodny wrote mytop, and he and the MySQL
community maintain it. Figure 12 shows an
example of the mytop
utility.
The mytop utility is open
source and licensed under the GNU Public License version 2 (GPL v2).
You can download mytop at http://jeremy.zawodny.com/mysql/mytop/.
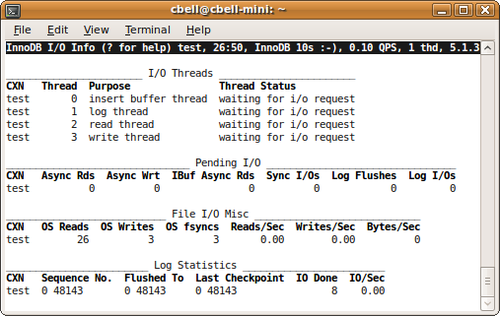
9.3. InnoTop
InnoTop is another system activity report that resembles a Linux
performance tool. In this case, it mimics the top command and was inspired by the mytop utility. It has many of the same tools
as mytop, but is specifically
designed to monitor InnoDB performance as well as the MySQL server.
You can monitor key statistics concerning transactions, deadlocks,
foreign keys, query activity, replication activity, system variables,
and a host of other details. InnoTop is widely used and considered by
some to be a general performance monitoring tool. It has many features
that allow you to monitor the system dynamically. If you are using
InnoDB primarily as your default (or standard) storage
engine and want a well-rounded monitoring tool you can run in text
mode, look no further than InnoTop. Figure 13 shows an example of the InnoTop
utility.
The InnoTop utility is licensed under the GNU Public License
version 2 (GPL v2). You can download InnoTop at http://innotop.sourceforge.net/.
9.4. MONyog
MySQL Monitor and Advisor (MONyog) is another good MySQL monitoring tool. It is a
proactive monitoring solution that allows you to set parameters for
key components for security and performance, and it includes tools to
help tune your servers for maximum performance. You can set events to
monitor specific parameters and get alerts when the system reaches the
specified thresholds. The major features of MONyog are:
Server resource monitoring
Identification of poorly executing SQL statements
Server log monitoring (e.g., the error log)
Real-time query performance monitoring and identification of
long-running queries
Alerting for significant events
You can download MONyog at http://www.webyog.com/en/.
10. The MySQL Benchmark Suite
Benchmarking is the process of determining how a system performs under certain
loads. The act of benchmarking varies greatly and is somewhat of an art
form. The goal is to measure and record statistics about the system
while running a well-defined set of tests whereby the statistics are
recorded under light, medium, and heavy load on the server. In effect,
benchmarking sets the expectations for the performance of the
system.
This is important because it gives you a hint if your server isn’t
performing as well as expected. For example, if you encounter a period
in which users are reporting slower performance on the server, how do
you know the server is performing poorly? Let’s say you’ve checked all
of the usual things—memory, disk, etc., and all are performing within
tolerance and without error or other anomalies. How, then, do you know
if things are running more slowly? Enter the benchmarks. In this case,
you can rerun the benchmark test and if the values produced are much
larger (or smaller, depending on what you are measuring), you know the
system is performing below expectations.
You can use the MySQL benchmark suite to establish your own
benchmarks. The benchmark tool is located in the sql-bench folder and is normally included in
the source code distribution. The benchmarks are written in oPerl and use the Perl DBI module for access to the server.
Use the following command to run the benchmark suite:
./run-all-tests --server=mysql --cmp=mysql --user=root --socket=<socket>
This command will run the entire set of standard benchmark tests,
recording the current results and comparing them with known results of
running the tests on a MySQL server. Example 4 shows an excerpt of the
results of running the above command on a system with limited
resources.
Example 4. The MySQL benchmark suite results
cbell@cbell-mini:~/source/bzr/mysql-6.0-review/sql-bench$
Benchmark DBD suite: 2.15
Date of test:        2009-12-01 19:54:19
Running tests on:    Linux 2.6.28-16-generic i686
Arguments:           --socket=../mysql-test/var/tmp/mysqld.1.sock
Comments:
Limits from:         mysql
Server version:      MySQL 6.0.14 alpha debug log
Optimization:        None
Hardware:

alter-table: Total time: 77 wallclock secs
  ( 0.12 usr  0.05 sys +  0.00 cusr  0.00 csys =  0.17 CPU)
ATIS: Total time: 150 wallclock secs
  (20.22 usr  0.56 sys +  0.00 cusr  0.00 csys = 20.78 CPU)
big-tables: Total time: 135 wallclock secs
  (45.73 usr  1.16 sys +  0.00 cusr  0.00 csys = 46.89 CPU)
connect: Total time: 1359 wallclock secs
  (200.70 usr 30.51 sys +  0.00 cusr  0.00 csys = 231.21 CPU)
...
|
MySQL contains a built-in function called benchmark() that you
can use to execute a simple expression and obtain a benchmark result.
It is best used when testing other functions or expressions to
determine if they are causing delays. The function takes two
parameters: a counter for looping and the expression you want to test.
The following example shows the results of running 10,000,000
iterations of the concat function: mysql> SELECT BENCHMARK(10000000, "SELECT CONCAT('te','s',' t')");
+-----------------------------------------------------+
| BENCHMARK(10000000, "SELECT CONCAT('te','s',' t')") |
+-----------------------------------------------------+
| 0 |
+-----------------------------------------------------+
1 row in set (0.06 sec)
The value of this function is the time it takes to run the
benchmark function. In this example, it took 0.06 seconds to run the
iterations. If you are exploring a complex query, consider testing
portions of it using this command. You may find the problem is related
to only one part of the query and not related to lack of
indexes. |
The benchmarking suite can be a very powerful tool for diagnosing
your server. You should consider running the benchmarking tool on your
servers to create baseline performance statistics and compare these
results to the canned statistics in the suite.