1. Getting Started with MySQL Enterprise
MySQL Enterprise was launched in 2006 and comprises the Enterprise MySQL
server release, a set of monitoring tools, and product support services.
This new packaging is intended for customers who use MySQL for data
management. Early on, MySQL recognized the need organizations have for
stability and reliability. MySQL Enterprise was the answer to this
need.
Note:
If you are not ready to purchase a MySQL Enterprise subscription
or you want to try it out for a while before deciding, you can get a
trial subscription that will last for 30 days. Apply for a trial
subscription at http://mysql.com/trials/.
MySQL Enterprise adds the web-based MEM application, along with a separate MySQL server instance
to be a repository for the metrics collected by other applications
installed on your MySQL servers, called agents. MEM combines the metrics into
reports that you can enhance with heuristics called
advisors that help you enforce best practices based on MySQL research
and expertise. The reports are displayed on a web page called a dashboard.
The following sections describe the available options for the MySQL
Enterprise subscription service as well as an overview of the installation
process. Later sections describe the features and benefits in more
detail.
1.1. Subscription Levels
You can purchase the MySQL Enterprise Suite at one of four subscription levels,
called basic, silver, gold, and platinum. The basic level is the least
expensive and offers the fewest tools. The next three levels offer
graduated levels of tool support. Thus, you can choose the level that
best meets both your budget and needs for improving the availability of
your servers:
- Basic
This level includes the Pro version of the MySQL server. It
provides basic coverage for the MySQL server, including software
updates and two support incidents. Support turnaround and response
time is two business days. Also included is access to MySQL’s vast
knowledge base for researching common problems and solutions. This
level does not include the monitoring tools. The basic level is
best for organizations that need production-quality software but
may not need advanced monitoring or immediate response to support
issues.
- Silver
This level includes the options for the basic level along
with the monitoring tools with a limited set of advisors for
administration and upgrades. A phone support option is included,
with unlimited incident reports, and turnaround time is four
hours. The silver level is a good start for most organizations
that rely on MySQL for their database management solutions and
that want to ensure their installations are configured
correctly.
- Gold
This level adds the Advanced version of the MySQL server
(which includes partitioning) and includes all options for the
silver level plus additional advisors for monitoring replication
and memory. It also includes the MySQL Query Analyzer option for
the monitor. Consultation support is added, covering replication
and partitioning. Response times for incident reports are two
hours, with an emergency response option. The gold level is an
excellent choice for organizations that use replication as part of
their MySQL installations.
- Platinum
This level includes all of the options from the gold level,
plus all advisors, expanded consultation support for all areas,
24/7 phone support, and a one-hour response to incidents, with a
30-minute emergency response time. This level even provides an
option for having a custom build of the MySQL server. The platinum
level is for organizations that need the highest level of support
for their most critical data management needs.
With so many options to choose from, you can add more support as
your business grows. You can find specific details about pricing and
what is included with each level at http://mysql.com/products/enterprise/features.html.
1.2. Installation Overview
When you purchase a MySQL Enterprise subscription, you are given a product key
and login credentials to the MySQL Enterprise portal. Connection to this
portal is necessary to activate the MySQL Enterprise tools. The portal
is your one-stop location for downloading updates, checking for
upgrades, news, information about your subscription, and access to the
knowledge base.
The portal is called the MySQL Enterprise Customer Center and it
is located at https://enterprise.mysql.com/.
Note:
For offline installations and those without an Internet
connection on the server on which you want to install MySQL
Enterprise, you can download your product key via a file from the
portal and use that during the installation. You will also need your
advisory bundle .jar file. You
can download both of these files from the portal.
Visit the portal first to download the Enterprise tools
installation files for your platforms, your production release of the
MySQL server, the Getting Started guide, and Enterprise documentation.
Be sure to read the Getting Started guide, as it has specific
instructions for installing and configuring the Enterprise tools for Mac
OS X, Linux, and Windows platforms.
We briefly describe the steps necessary to
install and configure the MySQL Enterprise suite. Installation involves
the following steps (at a minimum):
Install the service manager component, including the metrics
repository (a separate installation of MySQL), which is operating
system–specific. For example, you would install the file named
mysqlmonitor-2.1.0.1096-osx-installer on
a Mac OS X system.
Activate your subscription and enable the Enterprise
Dashboard. During this stage, you are required to enter your product
key, either via a file or by logging into the MySQL Enterprise
portal.
Install the monitoring agent on your MySQL servers. This is
also operating system–specific. For example, you would install an
agent such as mysqlmonitoragent-2.1.0.1093-linux-glibc2.3-x86-32bit-installer.bin
on Linux systems.
Configure the dashboard to reflect your environment.
While it is possible to install the monitor agent on any server
and monitor another, it is best to install the agent on the server you
wish to monitor. This permits the agent to send operating system
statistics, performance data, and configuration parameters to the
Dashboard. If you install the agent on another system, the system
section of the Dashboard report for the MySQL server will be
blank.
Note:
It is possible to configure an agent to report statistics for
multiple servers as well as to report to multiple monitors. The former
lets a single agent monitor two or more instances of the MySQL server
on a single system; the latter allows multiple dashboards to report
data from MEM. Both of these scenarios are described in the MEM
reference manual.
The installation of the MEM package includes a self-contained web server and MySQL
instance that you install on the system where you want to host the
Dashboard and metrics collection. This system is the destination for
each of the monitoring agents. This process is very easy to perform and
does not require any web administration expertise.
During the installation of the monitor package, you will have to
make decisions about the names of certain accounts and note the location
(e.g., IP address) of your server. You will need this information when
installing the monitoring agents. The Getting Started guide notes all of
these items. Pay particular attention to the example screens in the
guide. It may be helpful to print out the guide and use it to write down
the information you supply during the installation for later
reference.
Installation of the monitoring agents is also very easy. Once your
monitoring server is up and running and the product key has been
validated, you can install one agent on each of the MySQL servers in
your network. Some systems may require manually starting the agent,
which is explained in detail in the guide.
Once at least one agent is installed and started, you can return
to the Enterprise Dashboard and start configuring it to fit your needs.
2. MySQL Enterprise Components
MySQL Enterprise comprises the MySQL server software, the MEM toolset, and
production support.
2.1. MySQL Enterprise Server
Two versions of the MySQL server are included in the MySQL Enterprise subscription.
The Pro version is the production release with the most stable feature
set. The Advanced version adds more experimental features—for example,
horizontal table and index partitioning, which can improve the
performance of very large databases.
2.2. MEM
The MEM forms the core of the continuous server monitoring and
alerts. The MySQL website states it best: “It’s like having a ‘Virtual
DBA Assistant’ at your side to recommend best practices to eliminate
security vulnerabilities, improve replication, optimize performance and
more.” Despite the marketing angle, the MEM gives you professional-level
tools to meet the growing needs of your business’s data center.
The MEM includes the following key features:
A single web-based display to monitor the health of all of
your servers
Over 600 metrics, including the MySQL server and its host
operating system
The ability to monitor performance, replication, schema, and
security
Immediate health status via an easy-to-read heat chart
Notification of metric threshold violations
Implementation of the best practices ruleset from the creators
of MySQL
The MEM is composed of a distributed web-based application that
you run on your internal network. A monitoring agent is installed on
each MySQL server that sends metrics to the web server component, called
the Enterprise Dashboard. It is here that you can see all of the
statistics and graphs that depict the status of your servers. There are
also advisors that implement the best practices for ensuring your
installations are properly configured and running at peak
efficiency.
2.2.1. Enterprise Dashboard
The face of the MySQL Enterprise tools is the Enterprise Dashboard, the
web application running on your monitoring server. The Enterprise
Dashboard provides a single location where you can monitor all of your
servers, either individually or in groups. You can see the
availability, security, and performance data for all of your servers
in one place. You can check the relative health of each, examine
graphs of performance and memory use, and see vital operating system
statistics for each server.
The Enterprise Dashboard presents monitoring and alert
information to you in an easy-to-read format. An example of a simple
installation is shown in Figure 1.
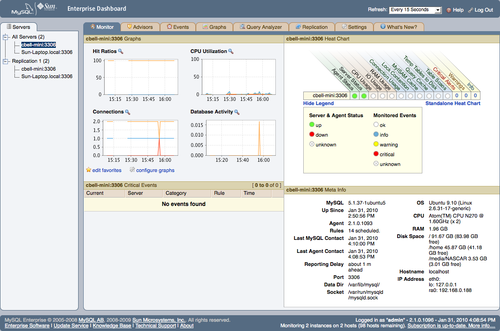
As you can see, the Enterprise Dashboard provides all of the
critical information on a single screen. There are tabs for advisors,
events, additional performance graphs, the Query Analyzer,
replication, and configuration settings. The What’s New? tab contains
links to news and events concerning the tools and your Enterprise
subscriptions.
2.2.2. Monitoring agent
The monitoring agent is a special lightweight application that gathers
information about a MySQL server, including statistics about the host
operating system. The monitoring agent is therefore the key component
in the monitoring tools. Designed to be installed on each server you
want to monitor, the agent is not only lightweight, but almost
transparent, with no noticeable performance degradation.
2.2.3. Advisors
The MySQL Enterprise tools include one feature that departs from typical enterprise
monitoring solutions: a mechanism that monitors specific areas of
system performance and configuration and sends alerts when a server
diverges from the best practices defined by the designers of MySQL.
This means you can get immediate feedback on anything that can cause
your system to become suboptimal in configuration, security, or
performance. This mechanism is called an advisor,
and there are many of them monitoring and reporting on a wide variety
of areas. The advisors supplied are:
- Administration
Monitors general database administration and
performance.
- Upgrade
Monitors upgrade conditions and sends alerts about
potential issues with version-specific bugs. Also suggests
upgrade strategies for fixing specific bugs related to upgrade
issues.
- Performance
Identifies differences in performance based on MySQL
performance best practice rules.
- Schema
Identifies changes to database and schema objects. Can
monitor changes and provide alerts when unwanted or unexpected
changes occur.
- Memory Usage
Identifies changes in memory usage and sends alerts when
suboptimal conditions arise.
- Security
Identifies and sends alerts when potential security
vulnerabilities arise.
- Replication
Identifies replication-specific conditions related to
configuration, health, synchronization (delays), and performance
issues.
- Custom
You can also create custom advisors to support your own
best practices or specific needs.
Each advisor provides comprehensive coverage of a specific area
of the server using a set of rules based on best practices. The
advisors help you identify where your servers need attention and give
you advice on how to improve or correct the situation. If the set of
advisors isn’t broad enough, you can create your own advisors to meet
your needs.
2.2.4. Query Analyzer (gold and platinum levels)
Complex databases and the complex applications that they tend to support
can result in the execution of complex queries. Given the
expressiveness of SQL, queries are often not written to execute as
efficiently as possible. Furthermore, poorly written queries can often
be the source of poor performance on other levels. Savvy DBAs
acknowledge this and often look to the queries first for database
performance diagnostics.
You can normally find a poorly performing query by watching the
slow query log or the process list (i.e., issuing a SHOW PROCESSLIST command). Once you have
identified a query that needs your attention, you can use
the EXPLAIN command to
see how MySQL will execute the query. While this process is well known
and has been used by DBAs for some time, it is a labor-intensive task
that does not easily lend itself to scripting. As the complexity of
the database grows, so too does the labor involved in diagnosing
poorly performing queries.
You can examine user queries with this method, but what do you
do when investigating application performance where the SQL statements
are included in the application code itself? This situation is among
the hardest to diagnose and repair, as it requires changing the
application. Assuming that is possible, how do you advise the
developers to improve their queries?
Unfortunately, the SQL statements in the application code are
rarely suspected of being the source of performance problems. DBAs and
developers are all too quick to blame the server or system instead of
application code or embedded SQL queries. Worse still, the MySQL
system does not support robust performance metric collection and there
is little support for finding troublesome queries.
Wouldn’t it be better to see a list of all of the long-running
queries on your server and examine the slowest ones? The Query
Analyzer component of the Enterprise Monitor tools provides this
help.
You can enable the Query Analyzer via the Enterprise Dashboard. Installation and configuration
require a little work, so be sure to consult the Getting Started guide
for details.
The Query Analyzer provides an aggregate display showing
performance statistics for queries in real time. It shows all of your
queries from all of your servers in one place so you don’t need to go
from server to server looking for poorly performing queries. This same
list maintains a history of the queries so you don’t have to worry
about the additional space for logs.
You can get two different views for each query: a canonical view
(no numeric data) to see a pictorial version of the query, and a
version that shows specific timing and access data for the query. Best
of all, the advisor can even alert you when a given query was executed
and on which server.
The Query Analyzer allows you to see which queries are
performing poorly and to identify a solution by examining the
suspected query’s execution plan. Clearly, this feature alone can
provide huge time savings, especially for situations in which you are
developing or tuning an application for deployment or need to optimize
your queries for improved performance.
2.3. MySQL Production Support
The MySQL Enterprise subscription includes access to support professionals who
can help you with development, deployment, and management of your MySQL
servers. Support includes problem resolution, consulting, access to an
online knowledge base of common solutions, and (with the platinum
subscription) a technical account manager who will be your point of
contact, helping you with all of your support needs.