The CPU of the server that SQL Server resides on will
do the processing for your applications running SQL Server. Any CPU
bottlenecks will thus impact the performance of your server. Monitoring
your CPU and the counters that reflect current CPU activity over a given
period enables you to identify gradual changes within your environment.
Identifying those changes before the situation becomes unmanageable is
the key to keeping management and your customers happy.
Using multiple
performance monitor counters to identify CPU problems is the best way to
determine when you have a CPU bottleneck. Table 1
lists some performance counters and recommended values for those
counters. You can refer to these recommended values when trying to
determine whether you have potential CPU issues.
Table 1. CPU Counters and Their Recommended Values| Counter Name | Description | Recommended Values |
|---|
| Processor: % Processor Time (Total) | The percentage of time the processor spent executing a non-idle thread | > 80% longer than 15 mins | | Processor: % Privilege Time | The amount of time spent executing system processes | < 30% | | System: Context Switches | The rate that processors switch among the threads | ~5000 per CPU | | System: Processor Queue Length | The number of ready threads in a queue | < 2 per Processor | | SQL Statistics: Batch Requests/Sec | The batch requests received by SQL Server | Use baseline | | SQL Statistics: SQL Compilations/Sec | The number of SQL Server compilations | > 10% of batch requests/sec | | SQL Statistics: SQL Recompilations/Sec | The number of SQL Server recompiles | > 10% of SQL compilations/sec |
|
This section primarily focuses
on the performance monitor and DMVs, but don't forget about tools like
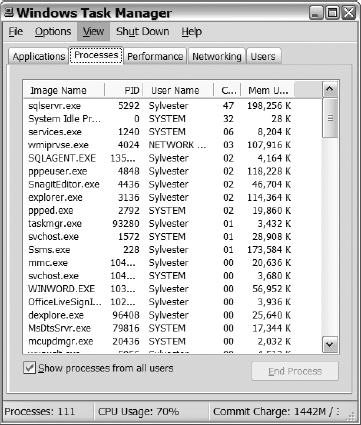
the Task Manager. Using Task Manager to monitor CPU is a quick-and-easy
method of determining if your CPU is high and the application that is
using the bulk of it. When you know what is consuming your CPU, you can
better determine the best course of action for further investigation. Figure 1 shows an example of Windows Task Manager Processes tab.
|
The thresholds may
vary from environment to environment and may need tweaking to identify
problems in your environment. Use the thresholds from Table 14-1 as a starting point for monitoring your environment, not as absolute values that you are bound to stay within.
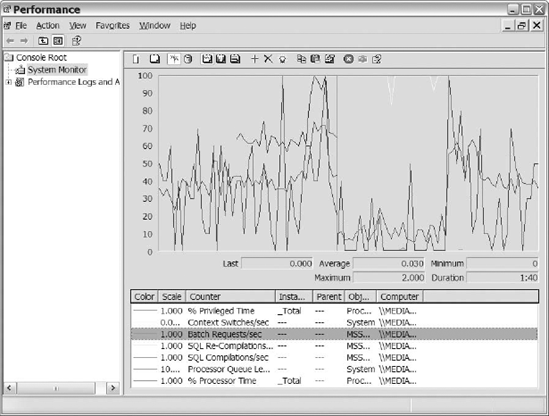
Once the performance monitor
is launched, the first thing we do is remove the default counters and
add the counters for the resource that we are monitoring. For this
example, we added the counters listed in Table 14-1
and any other counters that we have found useful for monitoring CPU.
After adding the counters to the display, you should go through them and
remove the counters that are in line with your baseline or the
thresholds listed in Table 1.
That way, you remove some of the "busyness" on the screen, and the only
counters that remain will be the counters that you really need to
evaluate and analyze. Figure 2 shows an example of the performance monitor with the counters listed in Table 1.
1. Windows Counters That Indicate CPU Utilization
This section provides additional information about the Windows counters listed in Table 14-1. The Processor object lists two counters that we want to discuss: % Processor Time and the % Privilege Time. The System
object lists the other two counters that we care about: Context
Switches and Processor Queue Length. Following are our thoughts on these
four key counters:
% Processor Time:
The percentage of CPU used on your server. Ideally, we like to keep our
servers running in the 20% to 50% range. Spikes above this range will
occur, so don't be alarmed when your server temporarily runs high. You
should try to identify the process or processes causing the increase in
your CPU when it sustains above 80% for a given period. That threshold
is one indicator that you may be headed toward a CPU bottleneck. % Privilege Time:
A counter that helps you identify the impact of kernel or system
processes on your server. The execution of system processes should
consume less than 30% of your total CPU. When this value is consistently
greater than 30%, it probably indicates that a Windows service is
having a problem. Context Switches/Sec:
These counters list the number of SQL Server threads switching among
processors. A high number of context switches can prove costly to your
CPU. Numbers higher than 5000 per second could indicate problems, but
review the other counters in this section before making that
determination. If counters like Processor Queue Length and
Compilations/Sec look good, then chances are your context switches are
okay. Another good reference point is your server baseline, which will
contain the context switches when the system performance was acceptable.
Track changes in the baseline number to help you identify gradual
changes. Processor Queue Length:
This counter identifies the number of ready threads waiting on
processor resources for processing. Numbers exceeding two per processor
should definitely encourage you to investigate CPU. Threads in a ready
state waiting on processing indicate that processes are waiting on their
opportunity to run. When threads are waiting to run, the applications
are not processing requests as fast as they would like to. That could
definitely be a problem for the applications using the server.
2. SQL Server Counters That Impact CPU
This section discusses the
SQL Server counters that track CPU-intensive processes that influence
your CPU. The counters do not necessarily indicate that you will have
performance problems because of the values of the counters. However, CPU
utilization should be lower on your system as the following counters
values decrease.
Batch Requests/Sec:
Measures the number of batch requests received by the SQL Server
instance. This number generally represents the activity on SQL Server.
Unfortunately, this counter does not capture every statement executed in
a stored procedure, but it is the best counter to use to gauge the
activity on SQL Server. Servers
with more than 1000 batch requests/sec generally carry a heavy
transactional load. Busy database servers are not a bad thing, but they
could cause CPU problems. So baseline your servers and keep an eye on
the number of batch requests/sec against your server. SQL Compilations/Sec:
Represents the number of compiles that occur on your SQL Server
instance. The first execution of a query on SQL Server generates a
compilation and stores the execution plan in the procedure cache. When
the query executes again, SQL Server checks to see if that execution
plan exists in the procedure cache. Reusing an execution plan found in
the procedure cache ultimately saves SQL Server the CPU time needed to
compile a plan. Applications that execute ad hoc queries don't take
advantage of execution plan reuse, causing increased CPU as plans must
be generated often. SQL
Server compilations should be less than 10% of your batch requests/sec.
Results greater than that threshold probably indicate that an
application running against that instance of SQL Server is not taking
advantage of execution plan reuse. Using Dynamic SQL and stored
procedures increases the chances of execution plan reuse, minimizing the
number of compiles. SQL Recompilations/Sec:
Represents the number of recompiles that occur on your SQL Server
instance. SQL Server decides to recompile for a number of reasons, but
some of the most common are statistics updates, schema changes, changes
to an index used by an execution plan, and your specifying the recompile
option. Once a plan is marked for recompile, the next batch that
executes the query will cause the recompile to occur. Recompiles are CPU
intensive, especially on complex queries. SQL
Server recompilations should be less than 10% of the number of SQL
Server compilations that occur on your instance of SQL Server. When your
system exceeds that threshold, you should spend some time identifying
the cause of the recompiles. Pay close attention to recompiles after
application upgrades. Recompiles after an upgrade generally indicate new
changes in the application that are causing the recompiles to occur,
and those changes may end up affecting performance. Your baseline can be
useful when comparing change in the number of recompiles on your
system. Recompiles will happen, but minimize them on your system if you
can.
While using the Windows
counters, try to combine the results of counters to help identify CPU
bottlenecks. When the CPU is sustaining above 80% and the processor
queue is above its thresholds, then that combination should force you to
investigate the CPU further to ensure SQL Server is not causing a CPU
bottleneck.
3. DMVs for Monitoring CPU
SQL Server provides a number
of Dynamic Management Views (DMVs) for monitoring CPU. Understanding the
relationship between threads, workers, schedulers, and tasks is crucial
to understanding the relationship between the CPU DMVs. Here's what you
need to know:
SQL Server starts, spawns a number of threads, and associates workers to them. A query or batch is broken into one or multiple tasks. The task is assigned to a worker for the duration of the query or batch. Workers are assigned to a scheduler and each scheduler maps to a processor to run.
Let's take a closer look at
these DMVs to get a better understanding of the output that they
provide. The following list describes some of the data returned by these
views:
sys.dm_os_threads:
Lists information about the threads created when SQL Server started.
These are operating system threads that currently run under the instance
of the SQL Server executable. This view is useful for monitoring CPU
because it can provide information about runaway threads within the
executable along with linking information for the other CPU DMVs. sys.dm_os_workers:
Provides information about the workers assigned to threads within SQL
Server. When a worker is ready to run, the worker moves to the front of
the runnable queue and tries to run up to 1000 times. After the 1000
tries, the worker moves to the back of the queue. This DMV also returns
information about the worker (such as the number of tasks the worker
executed), the state of the worker, IO used by the worker, the number of
ms_ticks that the worker spent in a suspended and runnable state along
with many more columns. Besides important information about the workers,
this DMV returns important information for linking to threads,
schedulers, and tasks. Spend some time understanding this DMV; it should
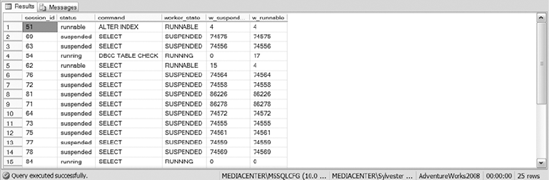
prove useful when monitoring your CPU. The query in Listing 1
is one that we frequently use and is found in SQL Server Books Online.
This listing shows you how long worker threads have been active compared
to suspended. The results of Listing 1 are shown in Figure 3. Example 1. SQL Code That Identifies the Amount of Time a Worker Has Been Running Compared to Being Suspended
SELECT t1.session_id,t1.status,t1.command AS command,
t2.state AS worker_state,
w_suspended = CASE t2.wait_started_ms_ticks
 WHEN 0 THEN 0 ELSE t3.ms_ticks - t2.wait_started_ms_ticks
END,
w_runnable = CASE t2.wait_resumed_ms_ticks
WHEN 0 THEN 0 ELSE t3.ms_ticks - t2.wait_resumed_ms_ticks
END
FROM sys.dm_exec_requests AS t1 INNER JOIN sys.dm_os_workers AS t2
 ON t2.task_address = t1.task_address
CROSS JOIN sys.dm_os_sys_info AS t3
WHERE t1.scheduler_id IS NOT NULL and session_id> 50
|
sys.dm_os_schedulers:
Lists information about the schedulers and the workers assigned to
them. This DMV has several interesting columns, including columns that
let you know how many workers are associated with each scheduler, how
many workers with tasks associated to them are waiting on the scheduler,
and the number of active workers each scheduler currently has.
Monitoring this view is important because you need to know when the
schedulers start to deviate from your baseline. The more workers waiting
on scheduler time increases the likelihood of CPU bottlenecks. Make
sure you proactively monitor this view in your environment and identify
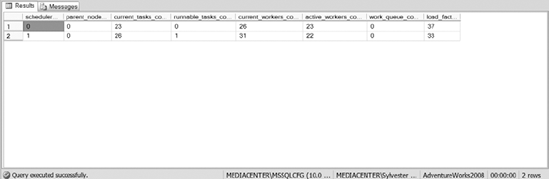
causes for change in this view. Listing 2
contains a query that we frequently run to identify the workload of our
schedulers. We pay close attention to the amount of workers that are
queuing, specifically the count in the work_queue_count column. Figure 4 contains the results of Listing 2. Example 2. SQL Script That Gathers Statistics on Your Schedulers
SELECT scheduler_id,parent_node_id,current_tasks_count,
runnable_tasks_count, current_workers_count, active_workers_count,
work_queue_count, load_factor
FROM sys.dm_os_schedulers
WHERE scheduler_id < 255
|
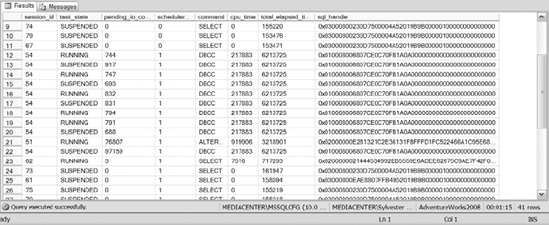
sys.dm_os_tasks: Gives you information
about each active task within your SQL Server instance. This DMV has
columns that provide you with the physical IO performed by the task, the
state of the task, and the scheduler the task is running on, along with
several other columns. This DMV also contains columns about the request
that caused the creation of the task. That's really important when you
want to figure out the query or batch that the task is executing. Listing 3
contains a sample script that shows you how to identify the query that
caused the creation of the task. The results are shown in Figure 5.
Example 3. SQL Script That Shows the Number of Tasks in a Particular task_state
SELECT r.session_id,task_state,pending_io_count,
r.scheduler_id,command,cpu_time,
total_elapsed_time,sql_handle
FROM sys.dm_os_tasks t
 join sys.dm_exec_requests r on t.request_id =
r.request_id and t.session_id = r.session_id
WHERE r.session_id > 50
|
When monitoring your
CPU, we also discussed the impact of the number of compiles on your
system. SQL Server provides you with the sys.dm_exec_query_optimizer_info
DMV, which captures information about the SQL Server optimizer. This
view contains information about the total number of optimizations, the
average elapsed time for the number of optimizations, the cost of the
optimizations, and several other columns. With this information, you can
determine the cost of the compiles against your system. That may help
you convince your developers to use stored procedures over the ad hoc
queries that they run in your environment.
|