Compare performance
As usual, we intend to compare the mainboard's
speed in two modes: in nominal mode and during overclocking of all system
components processor, integrated graphics core, memory. The first mode is
interesting because it demonstrates how well the mainboards work with their
default settings. There is a known fact that most users do not tweak their
system, they simply choose the optimal BIOS settings and do nothing else. That
is why we run a round of tests almost without interfering in any way with the
default mainboard settings. The results on the diagrams are sorted out in
performance descending order.
Nominal
mode
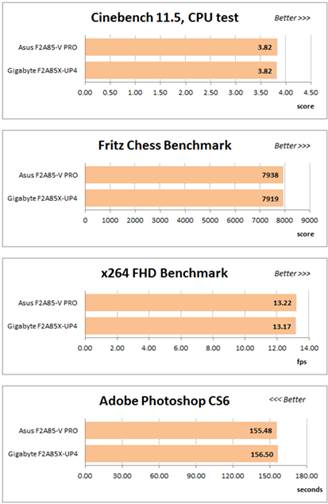
We used Cinebench
11.5. All tests were run five times and the average result of the five runs was
taken for the performance charts.
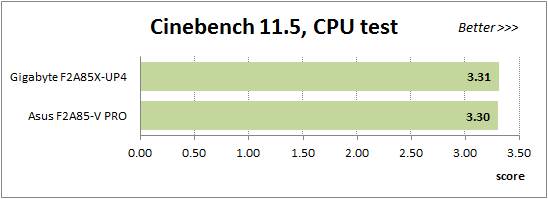
We
used Cinebench 11.5.
We used Fritz Chess Benchmark utility for a
long time and it proved to be very illustrative. It generates repeatable
results, its performance is scales perfectly depending on the number of
involved computational threads.
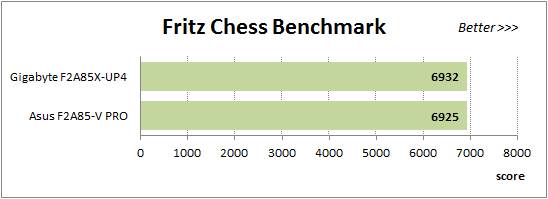
Fritz
Chess Benchmark Utility
X264 FHD Benchmark v1.0.1 test allows
comparing system performance against an existing database of results. The
average of five consecutive passes is presented on the diagram below:
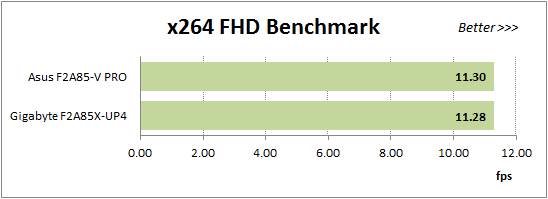
X264
FHD Benchmark v1.0.1 Test
We measure the performance in Adobe
Photoshop CS6 using our own benchmark made from Retouch Artists Photoshop Speed
Test that has been creatively modified. It includes the typical photo editing
of four 24-megapixel images from a digital photo camera.
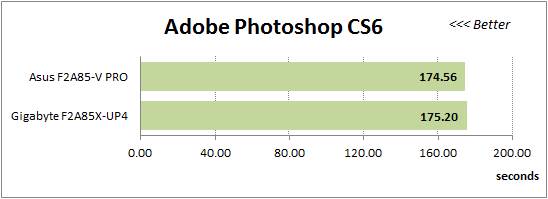
Measure
the performance in Adobe Photoshop CS6
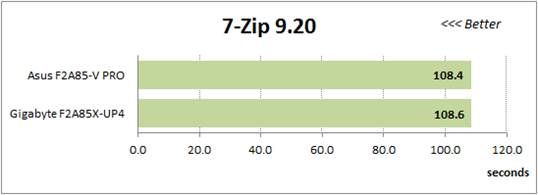
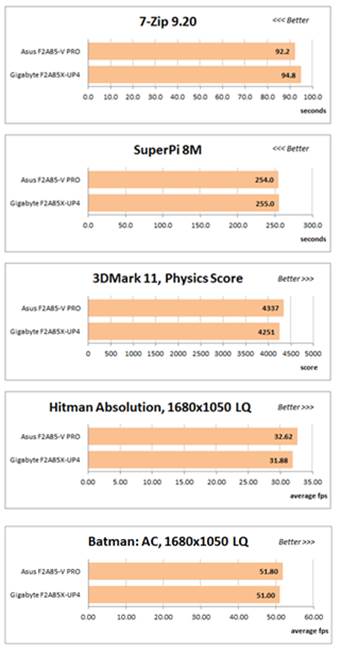
In the archiving test a 1 GB file is
compressed using LZMA2 algorithms, while other compression settings remain at
defaults.
The
archiving test
Like in the data compression test, the
faster 8 million of Pi digits are calculated, the better. This is where the
number of processor cores doesn’t really matter, because it creates
single-threaded loads.
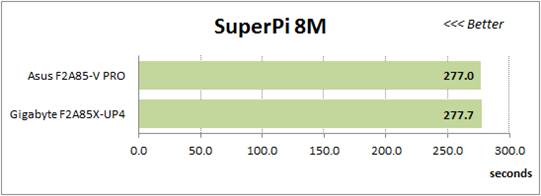
The
faster 8 million of Pi digits are calculated, the better.
The next graph shows the results of the
3DMark11 CPU test - Physics Score. This score is obtained in a special physics
test that emulates the behavior of a complex gaming system working with
numerous objects:
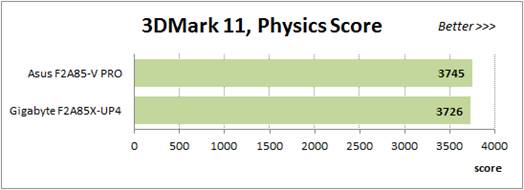
3DMark11
CPU test - Physics Score
The benchmark integrated into Hitman
Absolution game turned out to be very convenient. It can be launched directly
from the game, from the game launcher utility and even from the command prompt.
For a minimum acceptable result, we should use the lowest image setting and one
of the lower resolutions.
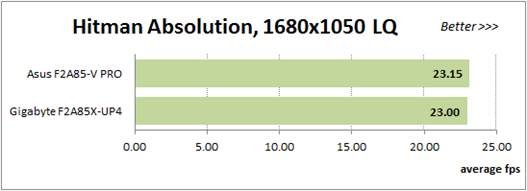
Hitman
Absolution
Game Batman: Arkham City is eager to
respond to any changes in the clock frequency of the CPU, but it uses DirectX
11. We ran game’s integrated benchmark five times with high image quality
settings and then take the average of the five runs for the diagrams.
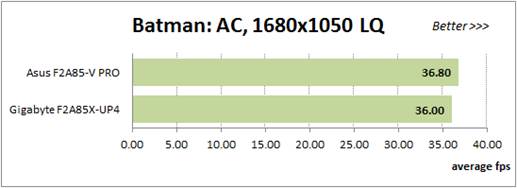
Batman:
Arkham City
Depending on the application, the leaders
alternate throughout the entire session in the nominal mode. However, we can
hardly see it on the graph: you will have to check out a comparative table with
the exact scores to see the difference. It is a known fact that related
mainboards working in identical conditions shows the same performance, which is
exactly what we see here. Only in Batman: Arkham City the performance
difference is more obvious and is a little above 2%, but in absolute terms it is
actually less than 1 frame per second, so it will not be noticeable in reality.
Overclocked
mode
During overclocking both mainboards
achieved the same results for the CPU, integrated graphics core and memory
parts, which is why we also predicted the same performance numbers in our
performance tests, too.
During
overclocking both mainboards achieved the same results for the CPU, integrated
graphics core and memory parts
The
two mainboard performed almost identically with two small differences.
All in one, the results during overclocking
are quite predictable. The two mainboard performed almost identically with two
small differences. First, look at the graphs you might think that all the
results that have been arranged in alphabetical order, because Asus mainboard
is always on top of the list. Also, in some applications, the performance
difference turns out to be a little higher than what we expect, because Asus mainboard
seem to be working with the memory in a slightly more efficient manner.
Specifically, when we compress files in 7-zip program, its performance
advantages approached 3%. Actually, it does not change anything for the user,
because both systems will create an archive for about 1 minute and a half, and
I suspect that if anyone noticed the difference between 92 and 95 seconds.
However, we will have to take this fact into account during final mainboard
scoring.
Energy
consumption
We performed our power consumption
measurements using an Extech Power Analyzer 380803.
This device is connected before the PSU and measure the power draw of the whole
system (excl. monitor), including power losses occur in the PSU itself. In idle
mode, we start the system and wait until it stops accessing hard drive. Then we
use LinX to load the CPU, and LinX and MSI Kombustor working simultaneously -
to produce complex heavy load.
Since Turbo Core technology lowers the
processor frequency below the nominal value under heavy CPU load, the real
power consumption of the system in nominal mode cannot be measured accurately.
Therefore, we must find a compromise and disable CPB Mode parameters in
mainboard's BIOS. This is a pretty serious allowance which changes the behavior
of the system dramatically, but we believe that the results are reliable enough
to observe. The problem is the Linx utility load CPU extremely heavy, more than
you expected from conventional programs. As a result, despite the CPB Mode
parameter is disabled, the measured system power consumption under heavy load
created by LinX turned out to be the same as we observed in the actual
application launched with enabled Turbo Core technology. We applied the same
principles when we selected utilities for creating complex system workload.
When we chose programs responsible for heavily loading individual system
components, we made sure that they created about the same need for power as
real application would in every-day usage scenarios. Results on the chart below
are sorted in an ascending order for power consumption.
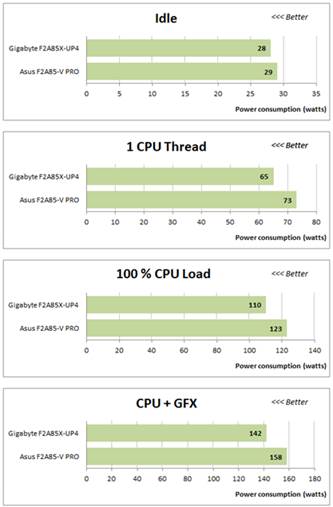
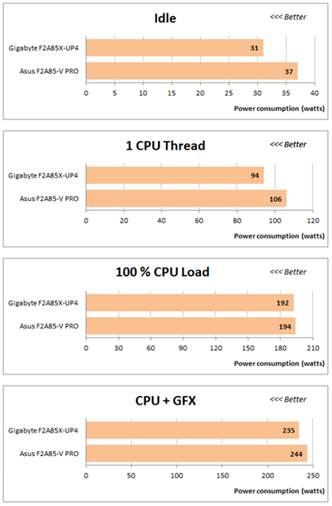
Gigabyte
Mainboard consumes less power
During this review we often see Asus mainboard
is slightly ahead in the race, but things changed to their complete opposite
during the power consumption tests: this is where the Gigabyte mainboard
consumes less power. Unlike the performance test, the difference is obvious and
sometimes even extremely clear. However, Asus F2A85-V PRO mainboard does also
have a few reserves left: you can disable the EPU Power Saving Mode parameter
in the mainboard BIOS. You may adjust the savings range to your liking,
depending on the specific system functionality and usage model. For us, we
decided to leave it at Auto. In this case, the power consumption of the system
based on various mainboards can be comparable. The next chart shows the
difference between the nominal and power-saving mode on the same Asus
mainboard.
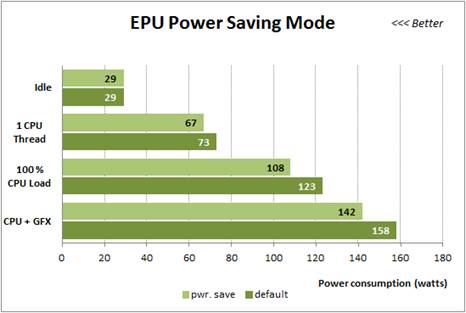
The
difference between the nominal and power-saving mode on the same Asus mainboard
However, once we get to overclocking,
Gigabyte mainboard again took the lead from Asus: it consumes less power in any
mode of operation and under any type of load. The systems power consumption
will be very similar only in very compute-intense applications. In all other cases,
Asus mainboard will consume more energy, while its performance is actually the
same.
Gigabyte
consumes less power in any mode of operation and under any type of load.