The Exchange administrator has no bigger task than to
ensure that the system stays up and running. Unfortunately, many
administrators are forced to live in reactive mode, constantly putting
out the biggest fire. Instead, administrators should strive to be
consistently in proactive mode. When you are in a state of proactivity,
you don't need to "react" to events, but instead you "respond" to them.
In other words, living in proactive mode means that you'll smell the
smoke before the fire starts. You'll detect little issues and quirks
ahead of time so you can correct them before they become big problems.
There are a few key areas that
you need to become proactive in if you want to be effective in keeping
your Exchange implementation healthy:
Keeping messages moving in and out of the Exchange organization
Ensuring that your Exchange servers aren't standing on their last leg
Using best practices in your implementation
This section shows you what you can do to proactively monitor the health of Exchange in these areas.
1. Ensure That Mail Flows Freely
Ensuring that
mail can be routed successfully throughout your environment is an
important area to look at when you are monitoring Exchange health. A
routing problem may not be easy to detect until it has compounded for a
while. This is one of those areas where you can't depend on your users
to notify you if there's a problem. If mail delivery is delayed, users
may not even call the help desk because they may just blame it on the
"slow network." And when messages are routed outside the organization,
there are so many factors outside your control that you may not even
realize the problem is with your servers.
Now more than ever, it's
important to pay careful attention to your routing topology because
Exchange relies heavily on an external dependency—Active Directory.
Exchange administrators may not be aware of site topology changes in
Active Directory (AD), and this can greatly affect how mail is routed.
1.1. Check Message Queues
When messages can't be routed to
the next hop toward their destination, they will be held in one of the
queues on the transport server that can't route the message. If users
are sending mail and the messages are taking a long time to reach their
recipients, there may be an excessive amount of messages in a queue.
Therefore, it's important to monitor your queues and ensure that no
issues exist that might prevent message delivery.
The two primary tools for
checking message queues in Exchange Server 2010 are the Queue Viewer and
the Exchange Management Shell (EMS). The Queue Viewer is accessible
through the Toolbox portion of the Exchange Management Console (EMC). To
open the Queue Viewer, follow these steps:
Open the EMC and browse to the Toolbox node in the Console tree.
The Work area will list several tools that are included in Exchange Server 2010.
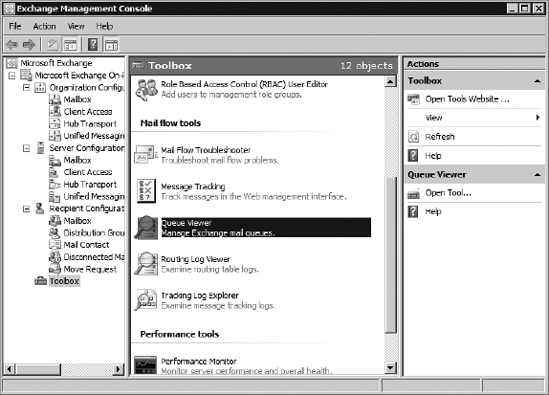
In the Mail Flow Tools section, double-click the Queue Viewer tool, as shown in Figure 1.
When the Queue Viewer is
opened, the Submission queue is shown by default. Other queues that
currently have messages in them will also appear. You can double-click
on the queue to open it and view the details of the messages that are
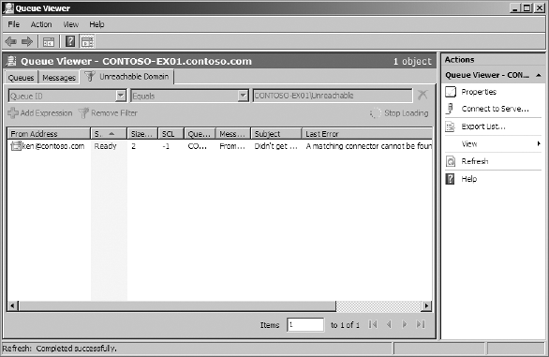
inside. Figure 2
shows a message stuck in the Unreachable queue because it couldn't find
a Simple Mail Transfer Protocol (SMTP) connector to route the message
over.
There are a few different things you can do to messages that are stuck in a queue. Table 1 lists your options.
Table 1. Actions You Can Take on Queued Messages
| Action | Description | Usage Notes |
|---|
| Suspend the message | Stops the message from being delivered and moved out of the queue | Does not apply to the Submission queue or the Poison Message queue. |
| Remove the message | Removes the message from the queue | You
have the option of sending a nondelivery report to the sender or just
silently dropping the message from the queue. This does not apply to the
Submission queue. |
| Export the message | Makes a copy of the queued message without removing the message from the queue | Cannot be done in the Queue Viewer. Exporting messages can only be performed with the EMS. |
| Resubmit the message | Moves the message out of the queue and resubmits it to the Submission queue | Causes the message to go through categorization again. |
1.1.1. Suspend and Remove Messages from Queues
You can suspend and remove messages using the Queue Viewer. Use the following steps:
In the Queue Viewer, select the Messages tab in the main pane.
The messages that are currently in the queue are listed.
Click on the message that you want to suspend or remove.
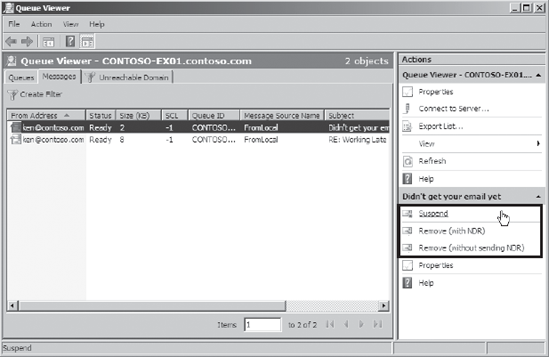
The Actions pane on the right will present the options that you have (Figure 3). Remember that you cannot perform these options on messages that are in the Submission queue.
Click
Suspend to suspend the message. Click Remove (With NDR) to remove the
message and send a nondelivery report to the sender. Click Remove
(Without Sending NDR) to drop the message from the queue without
notifying the sender. The sender may assume that the message was
delivered.
If
you choose to remove a message, you are prompted for confirmation.
Click the Yes button in the confirmation dialog box to continue.
1.1.2. Export a Message from the Queue Using the Exchange Management Shell
If you want to export a message from a queue, you must use the Exchange Management Shell. Run the Export-Message
cmdlet to export the message. You will need to specify the message
identity and the file path to where you want to export the message. To
get the message identity, you can view the properties of the queued
message in the Queue Viewer or you can run the Get-Message cmdlet. The following example retrieves the message identity for the messages that are in the Unreachable queue:
Get-Message -Queue CONTOSO-EX01\Unreachable | ft Identity,
FromAddress, Status
1.1.3. Resubmit a Queued Message Using the Exchange Management Shell
When you resubmit a message, you must resubmit all the messages in the queue. To resubmit messages, you use the Retry-Queue cmdlet in the EMS and specify the Resubmit parameter. The following example resubmits all of the messages in the Unreachable queue:
Retry-Queue CONTOSO-EX01\Unreachable -Resubmit $True
1.1.2. Use Protocol Logging to Diagnose Transport Problems
Protocol logging
provides a method for you to determine what's happening behind the
scenes in an SMTP exchange between servers. By turning on protocol
logging, you can determine what the servers are saying to each other.
Protocol logging can be enabled for send connectors or receive
connectors. Send connectors and receive connectors maintain separate
protocol logs.
To use protocol logging, follow these steps:
Turn protocol logging on at the connector that you want to log.
Determine or change the location of the protocol logs.
Examine the logs and understand what they are saying.
1.2.1. Enable Protocol Logging on Receive Connectors
To use the EMC to turn on protocol logging for receive connectors on a Hub Transport server, follow these steps:
Open the EMC and browse to the Server Configuration => Hub Transport node in the Console tree.
Select the Hub Transport server that contains the receive connector from the list in the Results pane.
In
the list of receive connectors, select the connector that you want to
enable protocol logging on and click the Properties action in the
Actions pane.
In the properties dialog box for the connector, select the General tab.
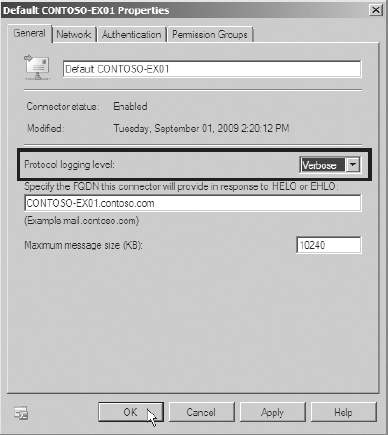
Next to the Protocol Logging Level option, select Verbose from the drop-down list, as shown in Figure 4.
Click OK to make the changes and close the properties dialog box.
You can also enable
protocol logging on a receive connector through the EMS. Use the
following command to enable protocol logging:
Set-ReceiveConnector ReceiveConnectorName
-ProtocolLoggingLevel Verbose
1.2.2. Enable Protocol Logging on Send Connectors
To enable protocol logging on send connectors in the EMC, follow these steps:
Open the EMC and browse to the Organization Configuration  Hub Transport node in the Console tree.
Select the Send Connectors tab in the Work area.
In the list of send connectors, select the connector that you want to enable protocol logging on.
In the Actions pane on the right, click the Properties action to open the properties dialog box for the connector.
In the properties dialog box, select the General tab.
To the right of the Protocol Logging Level field, select Verbose from the drop-down list.
Click OK to make the change and close the properties dialog box.
You can also enable the protocol logs for send connectors using the following EMS command:
Set-SendConnector SendConnectorName -ProtocolLoggingLevel
Verbose
1.2.3. Configure the Location of the Protocol Logs
When you enable protocol
logging, information is written to the protocol logs. On each server
there is one instance of these logs for send connectors and one instance
for receive connectors. To determine where those logs are or to change
the location of those logs, you can use the following steps in the EMC:
Open the EMC and browse to the Server Configuration => Hub Transport node in the Console tree.
In
the list of Hub Transport servers in the Results pane, select the
server that you want to modify the location of the protocol logs on.
In
the Actions pane on the right, select the Properties task to display
the properties dialog box for the server you have selected.
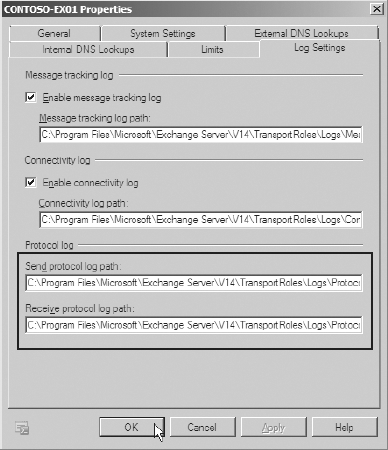
In the properties dialog box, click the Log Settings tab.
View or modify the folder path in the Send Protocol Log Path field or the Receive Protocol Log Path field (Figure 5).
If you changed any of the protocol log paths, click OK to make the changes and close the properties dialog box.
1.2.4. Read the Protocol Logs
After the protocol logs are
configured, you can open the logs and start reading through them. Browse
to the folder that the logs are stored in using the path that you
discovered previously. You can simply double-click on the log to open it
using Notepad.exe.
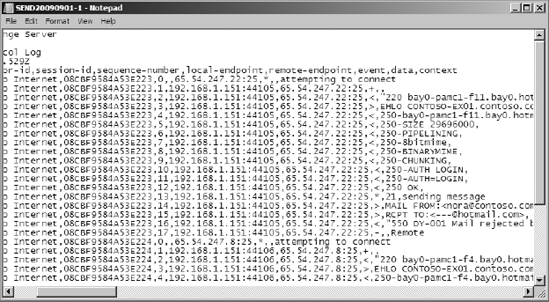
The protocol log
records several parameters that you can use to determine why a message
isn't being sent from or received by a particular server. The notable
fields used by the protocol logs are detailed in Table 2.
Table 2. Fields Used by the Protocol Logs
| Field Name | Description |
|---|
| date-time | The date and time that the event occurred. |
| connector-id | The name of the connector that the event occurred on. |
| session-id | The unique ID associated with the SMTP session. You can use this to distinguish SMTP sessions from one another. |
| sequence-number | A
number that is associated with each event in the current SMTP session.
This is used to determine which order things happened in. |
| local-endpoint | The IP address and port used on your Exchange server. |
| remote-endpoint | The IP address and port used by the external Mail server. |
| Event | Indicates
what was happening in the exchange. The session can be connected (+) or
disconnected (−). After a session is connected, commands can be sent
(>) or received (<). The log also indicates informational (*)
messages. |
Using the information in the
protocol logs, you can determine what exactly is happening during the
SMTP session and take action accordingly. Figure 11.6 shows the send connector protocol logs from a message that was rejected by a server.
1.3. Track Message Flow
The ability to track
message flow inside an Exchange organization is useful when you want to
determine what has happened to a message after the user sent it. You can
track message flow throughout an Exchange organization using the
message tracking logs. The message tracking logs keep track of messages
that are sent between transport servers and to and from mailbox servers.
These logs can be enabled on Mailbox, Hub Transport, and Edge Transport
servers. Message tracking logs are enabled by default, so unless you
explicitly turned them off, you can just start analyzing them.
You have a few options for viewing message logs:
Viewing the log files directly
Using the Tracking Log Explorer
Using the Exchange Management Shell
1.3.1. View the Log Files Directly
Directly viewing the log files
with a tool such as Notepad.exe might not be the most efficient method
of viewing the logs, but it's available to you as an option. Determine
where the logs are kept on the Transport server by running the following
EMS command:
Get-TransportServer ServerName | fl MessageTrackingLogPath
To determine where the logs are on a Mailbox server, use this EMS command:
Get-MailboxServer ServerName | fl MessageTrackingLogPath
After you get the path of the
logs, you can browse to the folder on your server. Log files on
transport servers are given the name MSGTRKyyyymmdd-#.log and mailbox server message tracking log files are named MSGTRKMyyyymmdd-#.log. The identifier yyyymmdd
corresponds to the year, month, and day that the log file was created.
Each log file is given a number that increments for each log file
created on that day. By default, after log files reach 10 MB, a new log
file is created with an incremented number. If your server has the Hub
Transport role and Mailbox role combined, you will see both the MSGTRK
log and the MSGTRKM log in the folder. However, the tracking log files
for the Transport server and Mailbox server are kept separate even if
it's the same server.
If you open one of the message
tracking log files in Notepad.exe, you will see a comma-separated file
similar to the one shown in Figure 7.
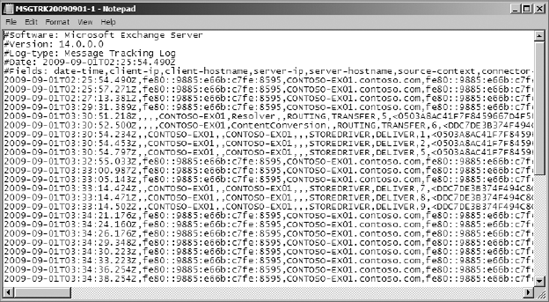
There are multiple fields in
this file that indicate useful information such as the time that the
message was sent or received, the servers that were involved in
transporting the message, and the sender, recipient, and subject of the
message. Although this information is available in the raw log files,
using the Tracking Log Explorer to analyze the information may be a
better choice.
1.3.2. Use the Tracking Log Explorer
The Tracking Log Explorer is
part of the Exchange Troubleshooting Assistant, which is used in
diagnosing multiple issues with Exchange. You can use the Tracking Log
Explorer to search through the message tracking logs and determine what
exactly has happened to a message. As shown in Figure 8,
there are multiple parameters you can perform the search with. If you
don't specify the sender or the server, the search is performed against
the Exchange server that you are currently logged in at.
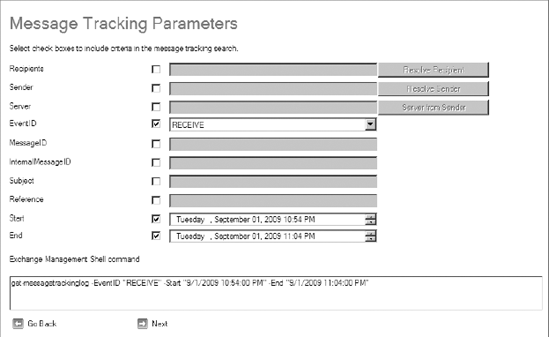
A field at the bottom of the
parameters dialog box specifies the EMS parameter that is used in the
search. You can copy and paste this command into the Exchange Management
Shell to duplicate the results that the Tracking Log Explorer got.
The following steps demonstrate how to use the Tracking Log Explorer to track a message:
Open the EMC and browse to the Toolbox node in the Console tree.
In
the Work area, double-click on the Tracking Log Explorer tool from the
list of tools in the Mail Flow Tools section of the EMC.
The
Exchange Troubleshooting Assistant launches and goes straight to the
Tracking Log Explorer. If this is your first time using the Tracking Log
Explorer, you may see a welcome screen that you can safely bypass.
In
the Message Tracking Parameters dialog box, select the parameters that
you want to use to perform the search. You can use the Sender,
Recipients, or Subject fields to find the message that you want to
track.
Click Next to search for the message in the message tracking logs.
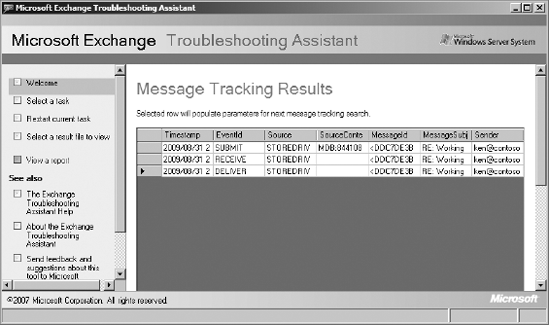
The
Message Tracking Results dialog box will display all the events that
were found matching your search criteria. If you look at the results
shown in Figure 9,
you can see that the particular message that was searched on was
submitted by the Mailbox server, received by the Transport server, and
delivered to the recipient's mailbox.
1.3.3. Track Messages in the EMS
You can use the Get-MessageTrackingLog
cmdlet to perform various message tracking searches in the EMS. The
easiest way to use the EMS for searching through message tracking logs
is to build the search using the Tracking Log Explorer and then copy and
modify the EMS command that the tool creates for you.
For example, the EMS command that was used by the Tracking Log Explorer in the previous example can be run directly in the EMS:
Get-MessageTrackingLog -Server CONTOSO-EX01
-MessageSubject "RE: Working Late"