3. Visual Studio 2010
With
the imminent release of Visual Studio 2010, debug aficionados will be
happy to learn that the Visual Studio team has invested many resources
in plugging some of the gaps that have existed in prior versions.
CTP Release of Visual Studio 2010
All
information presented here is based on the Customer Technology Preview
(CTP) release of Visual Studio 2010 available as a VHD download from
Microsoft (www.microsoft.com/visualstudio/en-us/products/2010/default.mspx). Microsoft reserves the right to rename, change, or remove features/functionality entirely in the final release version.
One
of the great new features of Visual Studio 2010 is the ability to debug
managed dump files. By taking a snapshot of a problematic process , the resulting dump file can now be loaded into
Visual Studio 2010. Due to some very fundamental changes in the core
debugging architecture, managed dump file debugging using Visual Studio
2010 requires that the application from which the dump file was
generated is built against version 4.0 of the CLR. If an attempt to
debug a prior version is made, Visual Studio displays an error dialog.
To perform managed dump file debugging, select the Open Project menu
item from the File menu. After the project has been created, you can
start debugging by going to the Debug menu and selecting the Start
Debugging menu item. Visual Studio then tells you what the latest event
was that caused the debugger to break and you can begin inspecting the
state of the process. Prior to Visual Studio 2010, all call stacks
showed the native code equivalent, now they show the actual managed
code frames. All other functionality works as before, and you can
double-click a frame to go to the corresponding managed source code.
Other functionality such as listing local variables of particular
frames also now works on managed code, although some restrictions apply
in the sense that if you work with optimized release binaries, local
variables may not always be accurate. Figure 9 shows an example of debugging a dump file generated on the 05Heap.exe application.
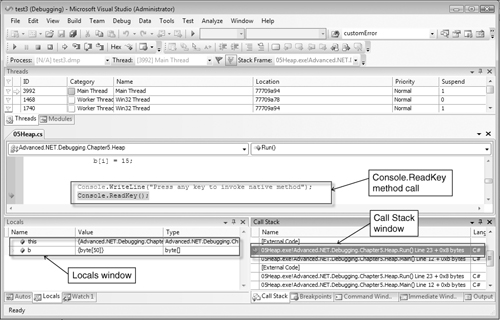
The example in Figure 9 shows what the debugger looks like when broken into while in the Console.ReadKey
method call. The Call Stack window on the right side shows the entire
managed code call stack, and the Locals window on the left side shows
the local variables that are part of the selected frame.
To
build an application targeting .NET 4.0, you can use the MSBUILD build
system that comes as part of .NET 4.0. Please note that the /toolsversion:4.0 switch must be used. By default, the MSBUILD build system will target version 2.0.
Did Microsoft Skip a CLR Version?
Between
major and minor revisions of the CLR and the .NET frameworks, the
version numbers started getting out of sync. The last major update to
the CLR was version 2.0, whereas the .NET framework has grown to
version 3.5. To minimize confusion, Microsoft decided to realign the
CLR and .NET framework versions in version 4.0. Both the CLR and the
.NET framework are now at version 4.0.
Another
great new debugging feature of Visual Studio 2010 is dubbed historical
debugging. The historical debugging feature helps greatly reduce the
amount of time that developers spend on theorizing and proving how an
application got into the state that it is currently in. Rather than
having to manually backtrack history,
the historical debugging feature records important events throughout
the execution of an application and allows you to step backward and
forward to those events during debug sessions. Because collecting this
historic application execution flow data can be an expensive
proposition and affect performance adversely, Visual Studio defaults to
a relatively low collection level. By default, only significant debug
events are recorded. The collection level can be controlled by
selecting Options on the Tools menu and clicking the Debugging, History
tab. Figure 10 shows the History Options page.
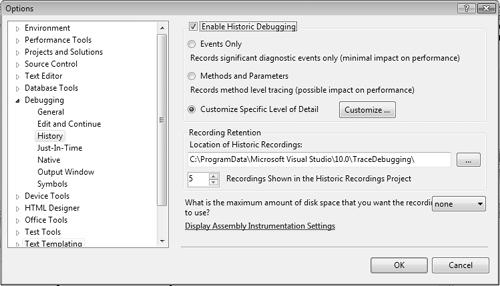
The Enable Historic Debugging section controls the level of debugging you want to enable. The Events Only radio button is the default and sets the collection level to minimum. The Methods and Parameters radio button collects method and parameter information and the Customize Specific Level of Detail
allows you to define your own collection levels. Additionally, you can
control the location of the recordings as well as maximum disk space to
be used to avoid exhausting the drive. Let’s look at a very simple and
contrived example of how historic debugging works. First, make sure to
set the recording level to Methods and Parameters and then load the History project located under: C:\ADNDSRC\Chapter9\History. The application is very simple and performs a division of two numbers entered by the user. Press F512 and -6
when prompted. As you’ll quickly see, a division by zero exception is
thrown and execution halts in the debugger. Bring up the Debug History
window (Debug, Windows, Show Debug History Window) to get the
historical information, as shown in Figure 11. to start debugging the application and enter numbers
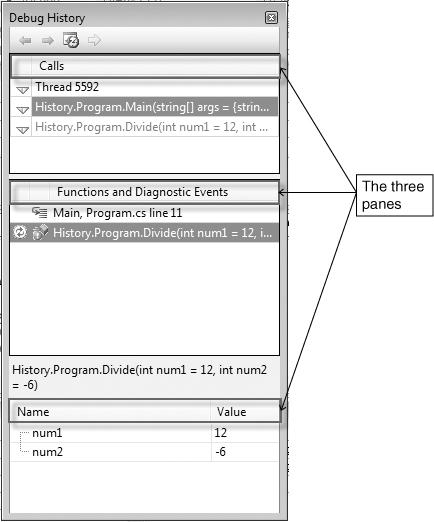
The Debug History window consists of three main panes. The topmost pane
shows the frames that lead up to the failure. In our case, the thread
entry called our Main method, which in turn called the Divide
method. The middle pane shows diagnostic events that occurred in the
selected frame as well as any other functions that may have been made.
In our example, the only diagnostics event that was recorded was the
fact that we called the Divide method. The bottommost pane shows the function called (Divide)
with its associated parameters. Here, we can see that the numbers we
entered are being passed to the function. Because the bottommost frame
represents the Divide method, we can now inspect the local
variables used in that method (by using the debugger Locals window) and
we can see that the number1 and number2 variables are set to 12 and 0, respectively. Because the second number should be -6, we can quickly (by code inspection) see that any negative number gets set to 0
resulting in a division by zero exception. Although this was an
extremely trivial example, it should be easy to see the power of this
feature, which allows you to backtrack and see how the application
ended up in the state it’s in.
In earlier
versions of Visual Studio, performing mixed mode debugging (managed and
native code) was only available on x86. Because the movement toward
64-bit computing has become more prevalent, the Visual Studio team
added support for x64 mixed mode debugging, making life much easier
when working with that architecture.
Finally,
although not a debugging feature per se, the way in which certain
exceptions are treated in the CLR has changed. More specifically,
exceptions that you cannot, generally speaking, recover from are no
longer converted to CLR exceptions. The primary reason behind this is
to avoid those exceptions being mistakenly caught in a catch-all
statement. A great example of this is the famous access violation
exception. Catching access violation exceptions is typically only going
to postpone imminent disaster and letting the exception stop the
execution of the application is advisable. By not converting and
inadvertently catching the exception, you have a better chance of
catching it during testing and fixing the root cause.
This
concludes our abbreviated tour of Visual Studio 2010. Great work has
gone into enhancing the debugging experience, making it much easier for
developers to track down the root cause of bugs in their applications.