1. CLR Profiler
The CLR Profiler is an
invaluable tool when it comes to troubleshooting memory-related issues
in .NET applications. It provides features such as
Heap statistics (including allocation graphs)
Garbage Collection Statistics
Garbage Collector Handle Statistics (including allocation graphs)
Garbage Collection Generation Sizes
Profiling Statistics
The installation process for the CLR Profiler is
straightforward. The installation package comes in the form of a ZIP
file. Simply extract the contents of the ZIP file to a specified folder
location (default is C:\CLRProfiler). If you extract all the
files from the ZIP file, you get both the x86 and x64 version of the
tool. To launch CLR Profiler, simply run CLRProfiler.exe. The
installation of the CLR Profiler is accompanied by the source code
making modifications and enhancements readily available.
After the CLR Profiler is launched, a dialog appears that contains a number of options as shown in Figure 1.
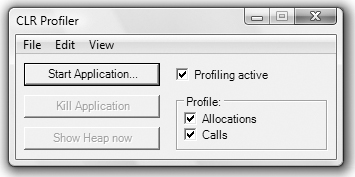
Clicking the Start Application button brings up a
dialog where you can choose the application you want to profile. After
an application and profiling action has been chosen, the CLR Profiler
launches the application and starts collecting data. The CLR Profiler
offers a number of different statistical views of the data collected. Figure 2 shows an example of a view when profiling the CLR Profiler itself.
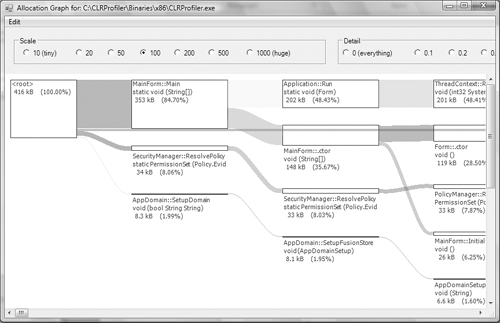
As can be seen in Figure 2,
the CLR Profiler offers a very detailed view of the allocation history
and hierarchical relationships in a given application run. We will look
at the specifics of the different CLR Profiler views in upcoming
chapters.
The data collected is output to a log file that is by default located in %windir%\Temp. The log filename takes the form
where <pid> is the process identifier of the process being profiled.
The CLR Profiler can also be started and controlled via the command line. Running the CLR Profiler using the /? switch opens a window with all the available options. For example, if I want to profile an application called hello.exe and log all profiling data to a log file named hello.log, I would use the command line
clrprofiler -o hello.log -p hello.exe
where the –o switch specifies the log filename and the –p switch specifies the executable to be profiled.
In subsequent chapters,
we will utilize both the command line and user interface (UI) to
illustrate the power of the CLR Profiler.
2. Performance Counters
Performance
counters are an important part of the troubleshooting process. During
the .NET framework installation process, a collection of performance
counters is installed. These performance counters represent a goldmine
of information when analyzing .NET application behavior. To view the
performance counters, the Windows Performance Monitor can be used. Table 1 lists all the performance counter categories that are part of the .NET runtime.
Table 1. .NET 2.0 Performance Counters Categories
| Performance Counter Category | Description |
|---|
| Exceptions | Performance counters related to exceptions thrown by .NET applications |
| Interoperability | Performance counters related to a .NET application’s relationship to COM, COM+, and external libraries |
| Just-in-time Compilation | Performance counters related to the Just In Time (JIT) compiler |
| Loader | Performance counters related to the loading of .NET entities (assemblies, types) |
| Lock and Thread | Performance counters related to threads and locking behaviors |
| Memory | Performance counters related to the garbage collector (GC) and memory utilization |
| Networking | Performance counters related to the data a .NET application sends and receives over the network |
| Remoting | Performance counters related to the remote objects that a .NET application uses |
| Security | Performance counters related to the security checks and balances that the .NET framework performs |
Throughout the book, the .NET performance counters will be utilized to analyze .NET applications. Figure 3 shows an example of a performance counter view when ran on an instance of the CLR Profiler (CLRProfiler.exe).