Named Sets
Before we deploy and test
these new calculations, let’s add a named set that references the three
test-market cities we mentioned earlier. This is quite easy to do.
Simply make sure the [Adjusted Sales Growth]
calculated member is selected in the Script Organizer pane of the cube
designer’s Calculations tab, and then add a new named set using the
Calculation tab’s toolbar, the Script Organizer’s shortcut menu, or the
Cube branch of the main menu. Name the set [Test Markets], and enter the following text in the Expression area:
{[Geography].[City].&[Albuquerque], [Geography].[City].&[Boise],
[Geography].[City].&[Kirkland]}
Tip
You
might find it easiest to compose the expression by typing the (curly)
braces, commas, and spaces yourself and generating the rest of the code
by dragging and dropping the appropriate members of the City attribute of the Geography
dimension from the Metadata tab of the Calculation Tools pane.
Specifically, you would need to expand the Geography\City\ Members\All
node and then drag and drop each of the three cities from the
alphabetically sorted list to the appropriate insertion points in the
Expression text box. |
Using
drag-and-drop techniques to specify members of a set results in rather
formal syntax usage in the generated code—namely, the use of the
ampersand (&) character and the square brackets around each name,
which are technically not necessary. The brackets are superfluous
because none of the names contains embedded spaces. The ampersand
character is used to reference a member key rather than a member name.
In our case, the name and the key are one and the same and the names are
unique, so the ampersand is not strictly required. You might want to
leave the brackets and ampersands in the expression code so subsequent
name changes involving the use of embedded spaces or member keys can be
accommodated without requiring major changes.
More on Script View
Save your changes
now, but before deploying them, switch back to script view to look at
the entire set of generated code. Note that each calculation you
entered, as well as the CALCULATE
script command that was there initially, simply form successive
sections of a single MDX script. These snippets of code appear within
that script in the same order in which they appear in the Script
Organizer pane displayed in form view.
Script
view does not contain .NET code, but the dichotomy between form view
and script view provides the same experience as working in form view and
code view in a Windows Forms project or an ASP.NET Web site in Visual
Studio. There is no concept in MDX of events or “code behind,” but the
dynamic of designer-generated code is very much in effect, and changes
in one view necessarily affect the other.
Furthermore, the
code editor supports many of the same features as the code editor in
.NET projects: Blocks of code can be expanded or contracted; word
completion, member listing, and real-time “squiggle” syntax error
prompting are supported; parameter information is supplied in ToolTips
when you use MDX functions; and you can enter comments using either of
the T-SQL comment syntax patterns (/*comment*/ and --comment) or the C-style (//comment). Comments entered in script view make your MDX code more readable and do not prevent form view from rendering properly.
Tip
Even when you’re not in script view, the Expression text region in form view supports many of the features just described. |
Debug Mode
The similarities with .NET
projects do not end there; they extend to the entire debugging
experience. You can set and clear breakpoints, and you can choose the
Debug/Step Over main menu option when a breakpoint is hit. This brings
up an important point: Until now, we have spoken of choosing the
Debug/Start Debugging main menu option and the Start Debugging toolbar
button as being equivalent to deploying the project to an Analysis
Services server. In fact, that’s not quite true. Choosing Build/Deploy projectname
from the main menu does perform that task (which is why we instructed
you to use it before), but the Start Debugging toolbar/menu options
deploy the project and
step into your cube’s calculation script if the cube designer is open
and the Calculations tab is selected when the option is selected.
Try this yourself by
clicking one of the Start Debugging toolbar or menu options with the
Calculations tab open. After the project is built and deployed, Visual
Studio places you in script view mode (even if you were in form view
mode when you selected the Start Debugging option), and then the whole
IDE goes into debug mode, just as it would for a .NET project. The Debug
toolbar becomes visible, the Debug menu becomes fully enabled, and a
special Debug pane opens up on the Calculations tab.
The Debug pane provides a
Pivot Table tab (onto which you can drag and drop objects from the
Metadata tab) and four interactive MDX tabs for diagnostic querying. The
Debug pane can be hard to see; you might need to auto-hide any docked
windows on the bottom edge of the Visual Studio parent window and then
move the splitter bar immediately below the MDX code editor to make the
debug pane readily visible. The Calculations tab debug mode is shown in Figure 4.
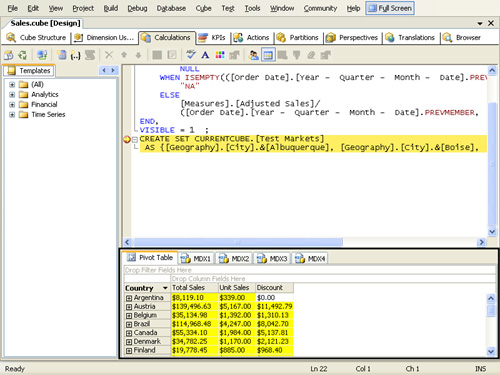
Note,
and consider the power of, the breakpoint set in the MDX code. This
powerful debugger tool can save you hours of tedious debugging, tabbing
back and forth between Visual Studio and SQL Server Management Studio.
Back to the Browser
Before we conclude
our discussion of calculations, let’s actually cover how to use them.
If you’re still in debug mode, select the Debug/Stop Debugging main menu
option or click the Stop Debugging button on the Debug toolbar (third
from the left, with a VCR stop button icon); you can also use the
Shift+F5 keyboard shortcut. Click on the cube designer’s Browser tab and
reconnect. In the metadata tree view, drill down on the Measures and
Geography nodes. Doing so will reveal your calculated measures and named
set as children. Note that the calculated measures do not appear
indented underneath either display folder or even our measure group. We
will correct this shortly.
Now construct a query using your new calculations by performing the following steps:
1. | Drag the Order Date dimension’s Year - Quarter - Month - Date hierarchy to the Row Fields area.
|
2. | Drag the Adjusted Sales and Adjusted Sales Growth calculated members to the Detail Fields area. (Be sure to drop Adjusted Sales Growth to the right of Adjusted Sales.)
|
3. | Drag the Test Markets named set to the filter pane (not to the Drop Filter Fields Here area of the Pivot Table pane).
|
4. | In the Rows Fields area, drill down on the Calendar 1997 node and then on the Quarter 1, 1997 node.
|
The results of these drag-and-drop steps are also displayed in Figure 5.
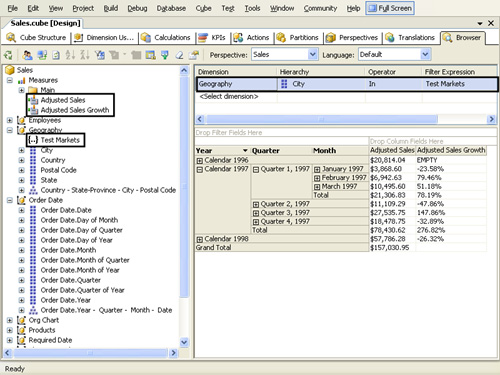
Notice that the Adjusted Sales Growth
figure is EMPTY for Calendar 1996 because there is no previous period
from which to calculate growth. For other cells, you should see the
proper growth figures (some of them negative) based on the Adjusted Sales number compared to its previous period.
In the previous
figure, the data displayed is filtered to reflect sales for only our
three test markets. If you want to see data for the entire cube,
right-click the named set’s line in the Filter pane and choose Delete
from the shortcut menu (or select it and press the Delete key). You
might want to then drill down on one of the displayed month’s nodes in
the Pivot Table pane to reveal the day-to-day Adjusted Sales Growth data. (Doing this while the Test Markets named set filter was in effect would have displayed many empty cells.)
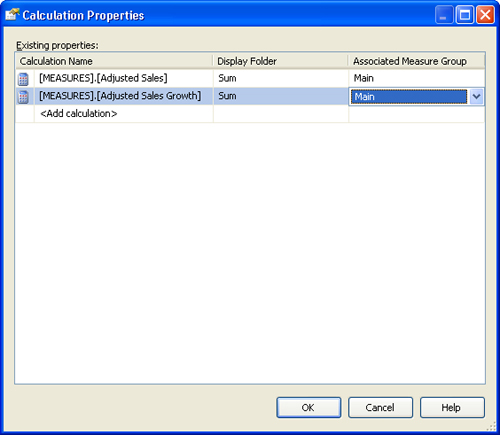
As we mentioned earlier, our two calculated measures do not appear within the Main measure group, let alone its Sum
display folder. We can remedy this by clicking on the cube designer’s
Calculations tab and then clicking the Calculation Properties toolbar
button (seventh from the right) or choosing the Cube/Calculation
Properties... option from the main menu. In the resulting Calculation
Properties dialog box, you can add the two calculated measures and
specify the measure group and/or display folder for each, as shown in Figure 6.