Using the Dimension Designer
The
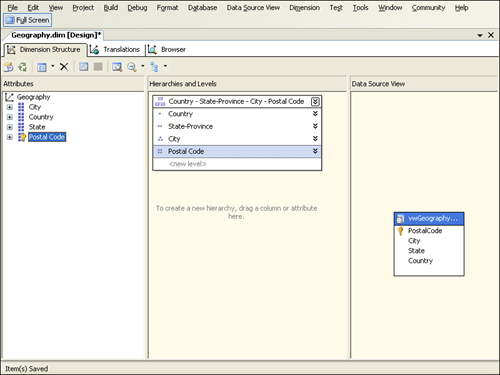
dimension designer, like the cube designer, has tabs across the top and
a three-pane view in the rest of the window. Within the Dimension
Structure tab, the Attributes pane is on the left, the Hierarchies And
Levels pane is in the center, and the Data Source View pane is on the
right.
Attributes can be
displayed in a tree, grid, or list view. Cycle through the views by
choosing the Show Attributes In option from the Dimension menu or the
Show Attributes In option from the Attributes pane’s shortcut menus. You
can also use the third drop-down button from the left on the Dimension
designer’s toolbar. Note that when you enter the list or grid views, the
Hierarchies And Levels pane pivots from the center to the upper left
and the Attributes pane shifts to the lower left. Certain properties for
attributes are available in the grid view, but all properties are
accessible through the Properties window regardless of which view you’re
in. We’ll discuss more on the Properties window later.
Attributes can also be renamed via their shortcut menus, the Name
property in the Properties window, or by pressing the F2 key when the
attribute is selected. Rename the Vw Geography attribute to Postal Code
now. The attribute is in fact based on the Postal Code field, but its
default name was set otherwise because it is the key attribute for the
Geography dimension (which is based on the view Vw Geography). Renaming
the attribute now will make things much more user-friendly when it comes
time to query the cube.
The dimension designer
makes it easy to create hierarchies from the universe of a dimension’s
attributes. Let’s create a hierarchy for the Geography dimension now so
that we can later query our cube data hierarchically by country, then
state or province, then city, and then postal code. Start by dragging
the Country attribute from the Attributes pane to the Hierarchies And
Levels pane (you may also right-click the Country attribute and select
the Start New Hierarchy option from its shortcut menu, or left-click the
Country attribute and select the Dimension/Start New Hierarchy option
from the main menu). This will create a new hierarchy with the default
name of “Hierarchy” in its own rectangular block, with the Country
attribute as the hierarchy’s top (and only) level.
You can drag additional
attributes onto this block to create additional levels (or select the
hierarchy and then either right-click an attribute and select Create
Level from the shortcut menu or left-click an attribute and select the
Create Level option from the Dimension menu). You can reorder the levels
within the hierarchy by using drag-and-drop, and you can delete and
rename attributes and hierarchies in a manner similar to other UI
scenarios already described. Also, instead of dragging attributes from
the Attributes pane to create hierarchies or add levels to an existing
hierarchy, you can drag columns from the Data Source View pane.
Using any of the
techniques just discussed, add the State, City, and Postal Code
attributes as the second, third, and fourth levels of the new hierarchy
(leaving Country as the first level). Once you’ve added all the levels,
rename the second level from State to State-Province and rename the hierarchy itself to Country - State-Province - City - Postal Code. The completed hierarchy design is shown in Figure 14.
The dimension
designer has two other tabs: Translations and Browser. You can use the Browser tab to
examine all of the dimension’s levels and each level’s members in a tree
view, but only after the cube has been processed (a step we’ll take you
through shortly).
Working with the Properties Window and Solution Explorer
Some
of the settings we’ve discussed, can be set through the Properties window. To see how this
works, return to the cube designer’s Cube Structure tab, click on any
measure in the Measures pane, and then look at the Properties window.
(Press F4 or choose the View/Properties Window main menu option if it’s
not visible.) To make the Properties window easier to view, assuming it
is docked, double-click its caption bar to undock it (you can
double-click its caption bar again to redock it), center it within your
screen, and resize it so its columns are wide and many rows are
displayed without the need to scroll. Your Properties window should now
look similar to Figure 15.
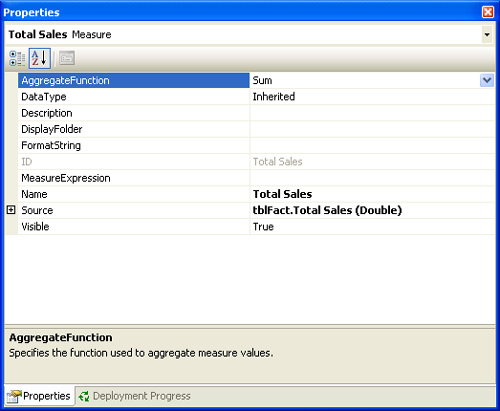
Notice how AggregateFunction and DataType
are visible and editable, as are several other properties. Click the
drop-down arrow in the upper-right corner of the Properties window, and
you should see all the measures in your cube displayed in the drop-down
list. Double-click the Properties window’s caption bar again to dock it,
and then select a dimension in the Dimensions pane. Undock the
Properties window a second time, and you’ll see that this dimension’s
properties are now editable and that all dimensions in your cube are
listed in the drop-down list at the top of the window. This technique
works for virtually any class of object in your cube, in any pane, in
any tab of the cube designer (except the Calculations and Browser tabs)
or dimension designer. Experiment with this technique in different parts
of the designers so that you can appreciate the breadth of power the
Properties window has in the cube editing process.
Before we move on to
processing and querying our cube, you should know that you can
manipulate high-level objects such as data sources, data source views,
dimensions, and the cube itself by opening them from Solution Explorer.
For example, to edit a dimension in the dimension
designer, instead of clicking its hyperlink in the Dimensions pane of
the cube designer, you can double-click its node in the Dimensions
folder of your project in the Solution Explorer window. Try this to see
how easily it works. Also, if you right-click any editable object in the
Solution Explorer window and choose View Code, you’ll see that the
basis for each object is a simple XML file. Imagine the cube
design/generation possibilities this raises for third-party and
custom-developed front ends.
Processing the Cube
You can process your
dimension in the dimension designer by using the second toolbar button
from the left or by choosing the Dimension/Process... option from the
main menu, but for now just close the dimension designer and click Save
when prompted. Back in the cube designer, you can process the entire
cube by using the Database/Process... or Cube/Process... option, or by
clicking the Process toolbar button (second from left). Processing the
cube or database automatically processes any pending changes to
dimensions they may contain.
Processing your
cube requires that your Analysis Services project be built and deployed.
When you choose to process your cube (do this now), if it hasn’t
already been built and deployed (which ours has not), you’ll be notified
that these steps are necessary and asked if you’d like them to be
performed before building. Click Yes. (Alternatively, you could first
execute the build and deploy operations from the Build branch of the
main menu.)
You
can watch the progress of the build and deploy processes in the
Deployment Progress window. Once these steps are complete, you’ll be
prompted with the Process Cube - <cubename> dialog box. The
Remove, Impact Analysis..., and Change Settings... buttons in this
dialog box provide precise control over how your cube is processed.