Creating a Cube with the Cube Wizard
Once you’re done
perfecting your data source view, close it and save your changes. You’re
now ready to build your cube! To do this, select the Project/New
Cube... main menu option, or right-click the Cubes folder in Solution
Explorer and select the New Cube... option from the shortcut menu to
bring up the Cube Wizard.
On
the Welcome page, click Next to advance to the Select Build Method
page. For our purposes, you’ll want to select the Build The Cube Using A
Data Source option button. You can leave the Auto Build check box in a
checked state if you’d like. If you do, make sure that the Create
Attributes And Hierarchies option is selected in the combo box right
below it. By examining your data source view’s schema, Analysis Services
can detect which tables in it are fact tables and dimension tables and
can sometimes determine which dimensional hierarchies should be created.
Click Next to move to the Select Data Source View page. Confirm that
the data source you created before is selected, and click Next again.
If you selected the Auto
Build option, the Detecting Fact And Dimension Tables page will display a
progress bar as the wizard analyzes your data source view and will
display a message when it’s complete, at which point you should click
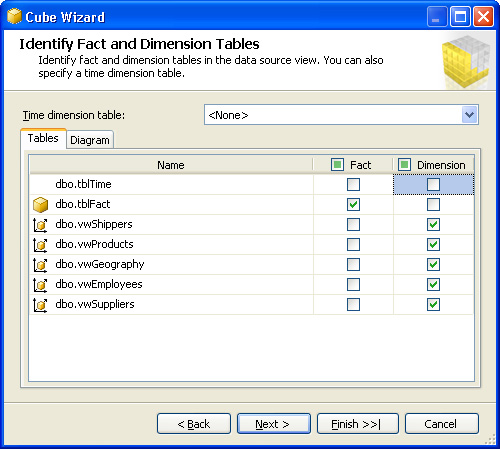
the Next button. In the Identify Fact And Dimension Tables page, you
will be asked to identify your fact tables and dimension tables. You
should leave both check boxes deselected for tblTime, select the Fact
check box for tblFact, and select the Dimension check boxes for all of
the other tables (views). If you selected the Auto Build option, default
selections might already be made for you, but make sure that both check
boxes are cleared for tblTime. You can configure each table from your
data source view to be a fact table or dimension table through the
Tables tab or the Diagram tab. (Actually, a table can be both a fact and
a dimension table, though this would be the exception rather than the
rule.)
When you have a
time dimension and are building it using a dimension table , you can indicate which table you’ll be using in the Time
Dimension Table combo box. For now, leave this setting as . If you receive error messages on a yellow
background at the bottom of the dialog box, you might want to click on
the Diagram tab to determine why one or more tables are incorrectly
configured. (These tables will appear in red.) Figure 6 shows the selections that should be made for this page. When you’re done, click Next.
On the Select
Measures page, you are asked to create your measures and measure groups.
By default, one measure for each numeric field in your fact table(s)
that is not a foreign key to a dimension table is listed here, and a
default measure (called Tbl Fact Count, in our case), based on the
record count, will be listed as well. The field-based measures will have
the same name as the field names on which they are based, with spaces
inserted where “intercap” characters exist. (For example, a field called
UnitPrice will create a measure with a default name of Unit Price.)
You can browse the first
1000 rows of any of your fact tables by right-clicking any measure
based on it (you can right-click anywhere on the measure’s entire row)
and choosing View Sample Data.... You can edit measure names by setting
the focus on the cell containing the name (by using the mouse or the
keyboard). Individual measures can also be deselected, preventing them
from being added to the cube. For our example, deselect Tbl Fact Count
because we will not need it.
One measure group is
created for each fact table you specified in the Identify Fact And
Dimension Tables page. Measure group names are editable—don’t be fooled
by the grey background that stays gray even when you click within the
cell. For our example, change the name of the single measure group
detected from tblFact to Main. When you’re done configuring your measures and measure groups, click Next.
If you selected
the Auto Build option, the wizard’s Detecting Hierarchies page will
display a progress bar as the wizard analyzes your data source view, and
it will display a message when it’s complete, at which point you should
click Next. On the Review New Dimensions page, all default dimensions
are listed (one per dimension table). Drill down on any dimension to
reveal the Attributes node in the tree view, and then drill down on the
attributes node to display all the suggested attributes (which can
become levels in a hierarchy). The attributes are formulated based on
the columns in the dimension table, and the wizard names them following a
scheme identical to the one it uses to name measures.
As with measures, you
can deselect any attribute to prevent it from being created. You can
change the default dimension and attribute names by right-clicking them
and selecting Rename Dimension or Rename Attribute or by left-clicking
them and then pressing the F2 key on your keyboard. You can also enter
edit mode on a dimension or attribute by clicking one, pausing, and
clicking again. Use one of these techniques to remove the “Vw” prefix
from the dimension names, for example, rename the Vw Products dimension
as “Products”, and make sure that you do this for each dimension. Each
dimension contains a like-named attribute, which also features the
undesired “Vw” prefix. We will rename these attributes later; you may
accept the default attribute names for now.
When you’re done
configuring your dimensions and attributes, click Next. On the
Completing The Wizard page, you can accept the default name for the cube
or type a new name more to your liking (for this example, name the cube
Sales) and then click Finish.
Using the Cube Designer
When
the Cube Wizard finishes processing, your cube design will be generated
and opened, placing you in the Cube Structure tab of the cube designer,
as shown in Figure 7.
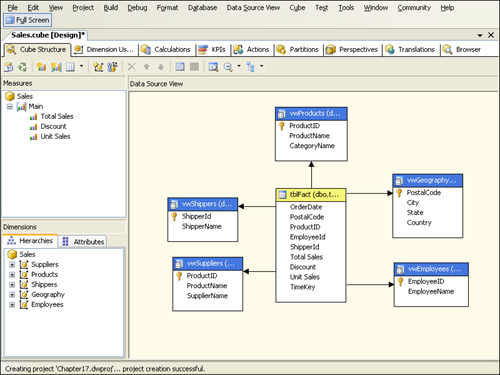
The cube designer has an
array of tabs across the top, and the Cube Structure tab is divided into
three panes: Measures on the upper left, Dimensions on the lower left,
and Data Source View on the right. This Data Source View pane depicts a
subset of the tables in the data source view upon which the cube is
based; it contains only the tables and views selected in the Cube Wizard
when we identified our fact and dimension tables.
Note
You
can add any other table to the Data Source View pane that may be
present in the base data source view simply by selecting the Data Source
View/Show Tables... main menu option, choosing the Show Tables...
option from the Data Source View pane’s shortcut menu, or clicking the
Show Table toolbar button (fifth from right). You
can also add tables related to a specific table in the Data Source View
pane by left-clicking the table and selecting the Data Source View/Show
Related Tables main menu option or right clicking the table and
selecting the Show Related Tables shortcut menu option. You can hide a
table from the Data Source View pane by selecting the table, then
clicking the Data Source View/Hide Table main menu option, choosing the
Hide Table shortcut menu option or clicking the Hide Table toolbar
button (fourth from right). These
actions have no effect on the base data source view itself because the
Data Source View pane is simply a convenient filtered diagram based on
the cube’s underlying data source view. |
By
default, the Measures pane contains a tree view with the cube name at
the root, measure groups appearing as the root’s children, and
individual measures listed as children of their measure groups. You can
change the tree view to a grid view via the Show Measures option in the
Cube menu, the Show Measures In option in the Measures pane’s shortcut
menus, or the Show Measures Grid/Show Measures Tree toolbar drop-down
button (fifth from the left). Measure groups and individual measures can
be added, deleted, renamed, or moved up and down through options on the
shortcut menus. Even the cube itself can be renamed in this way. In
grid view, only measures are listed; measure groups can be manipulated
only in the tree view. The measure’s data type and aggregate function
can be modified in the grid view. These and other properties can also be
edited through the Properties window.
Note
The
Cube/New Linked Object... main menu option, the New Linked Object...
shortcut menu option (available in the Measures and Dimensions panes),
and the New Linked Object toolbar button (seventh from left) allow you
to link or import measures, dimensions, and other objects from other
cubes into the one you’re editing. |
The cube designer is the
primary tool for designing and building cubes; the Cube Wizard simply
provides a front end to the designer to help get you started. If you
want to add new measures to the cube after running the wizard, you can
easily do so within the designer. Simply select the New Measure...
option from the Cube menu, the New Measure... option from the Measures
pane’s shortcut menus, or click the New Measure toolbar button (third
from left) to bring up the New Measure dialog box, shown in Figure 8.
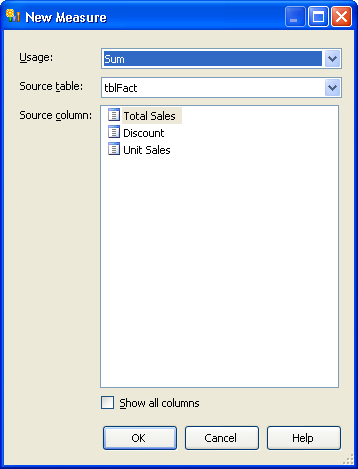
From
the Source column tree view that occupies most of the dialog box, you
can select the fact table field from which you want to derive your
measure and then click OK to create the measure. Only non–foreign key,
numeric fields are displayed by default; the Show All Columns check box
at the bottom left of the dialog box allows you to display (and select)
other fields.
You can also add
measure groups if fact tables exist that have not yet been assigned to
an existing measure group.
The
Dimensions pane allows you to inspect and maintain dimensions,
attributes, and hierarchies. It offers two tabs: Hierarchies and
Attributes. Both feature tree views of the dimensional structure of your
cube, with the cube as the root node and dimensions listed as the
cube’s children. Sensibly, attributes of a dimension appear as its
children on the Attributes tab; hierarchies of a dimension appear as its
children on the Hierarchies tab. On either tab, you can edit a
dimension’s name, delete the dimension, or move it up or down. You can
also create a new dimension through the Dimension Wizard or edit an
existing dimension in the Dimension designer.