The number one OLAP client in the world today is
Excel. For IT organizations, the ubiquity of Microsoft Office—and the
resulting simplicity of deployment and low cost—make Excel quite
popular. For users, the familiarity of the spreadsheet interface makes
Excel a highly requested front end. As a result, Microsoft has gone out
of its way to make the PivotTable and chart functions in Excel
especially OLAP savvy.
This means that whether
you prefer to use the full-blown Excel client application or the Office
Web Components (OWC), connecting users to your Analysis Services 2005
cubes is really easy. And because OWC is deployed as a set of ActiveX
controls, you can host PivotTables and charts in Web applications
(including ASP.NET pages) or Windows Forms applications (using COM
Interop). Best of all, because the Excel PivotTable and chart components
feature drag-and-drop field lists, you (and your users) can use these tools to query your cubes without any knowledge of MDX.
In this section, we’ll cover
how to use Excel as a bona fide OLAP client. The techniques laid out
here are for Excel 2003. If you’re using Excel 2000 or Excel 2002 (the
Office XP version), or if you’re using “Excel 2007” (as the version
after Excel 2003, still in beta at press time, will likely be called),
the steps and screenshots in this section will not align precisely with
what you experience. Regardless, you should be able to follow these
steps as a general procedure for working with cubes from Excel.
Working Within Excel
Important
The
techniques described in this section require that MSQuery, an Excel
installation option, be installed on your PC. If it is not, Excel will
ask you at a certain point if you want to install it. When asked, you
should answer Yes and supply your Office installation media if prompted. |
Before you venture
into using Office Web Components from within your own applications, you
should know how to connect PivotTables and charts to your cubes from
within an Excel spreadsheet:
In Excel, choose Data/Import External Data/New Database Query....
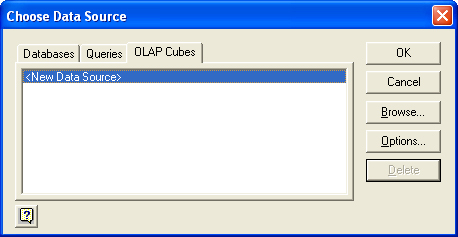
The
resulting Choose Data Source dialog box (which you might have used to
import relational data into Excel) has three tabs: Databases, Queries,
and OLAP Cubes. Use the OLAP Cubes tab (Figure 1) to attach a PivotTable to your cube.
Defining a Data Source
To define a data source, follow these steps:
1. | If
this is the first time you’ve imported OLAP data into Excel, the OLAP
Cubes tab will display only an option to add a new data source.
Double-click the <New Data Source> item in the list.
|
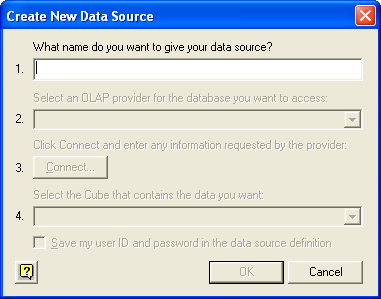
2. | In the Create New Data Source dialog box (Figure 2), type a name for the data source in field 1. A drop-down list box will become enabled in field 2.
|
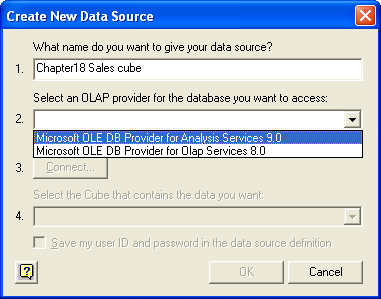
3. | Click
the drop-down list’s drop-down arrow, and you will see a list of all
OLE DB for OLAP providers that might be installed on your system (Figure 3).
Select Microsoft OLE DB Provider for Analysis Services 9.0 (the
official version number of SQL Server 2005 is 9.0), and then click the
Connect button in field 3.
|
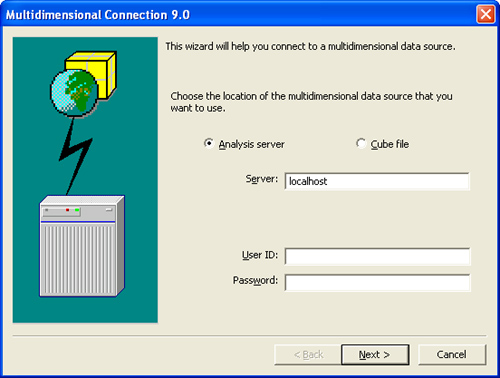
4. | In the special Multidimensional Connection 9.0 dialog box (Figure 4),
be sure that the Analysis Server option button is selected, and then
type the name of your server (which might be “localhost” or simply “.”).
Click Next. (Analysis Services uses integrated security, so you can
leave the User ID and Password fields blank.)
|
5. | The
dialog box should now list all Analysis Services databases on your
server. Select one and click Finish to return to the Create New Data
Source dialog box.
|
6. | A
drop-down list should now be enabled in field 4. Click the list’s
drop-down arrow to see a list of all cubes and perspectives in the
Analysis Services database that you selected in the Multidimensional
Connection 9.0 dialog box. Select a cube or perspective, and then click
OK.
|
7. | Your newly defined data source should now appear on the OLAP Cubes tab of the Choose Data Source dialog box. Double-click it.
|
Creating the PivotTable
The Step 3 page of the PivotTable And PivotChart Wizard (Figure 5)
should now be displayed. This can be confusing because we never
explicitly invoked this wizard, nor did we complete information on the
Step 1 or Step 2 pages. Our advice to you is to ignore the title of this
dialog box and simply make the appropriate selections.
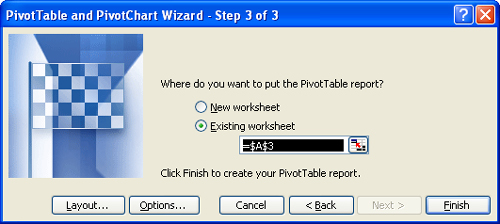
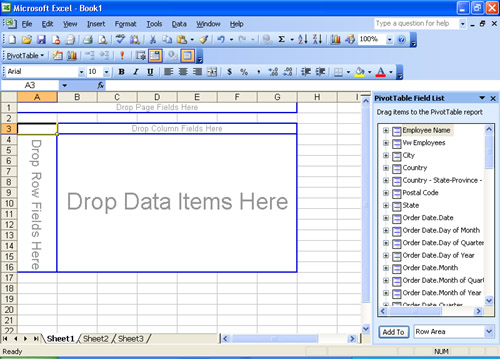
Specifically, you must
indicate whether you want to insert the new PivotTable in a specific
existing worksheet or a new one, and at what cell location, and then you
click Finish. You’ll see a blank PivotTable on the left of your screen
and a PivotTable Fields List window (either floating or docked) on the
right containing all of your Attributes, Hierarchies, and Measures (Figure 6).
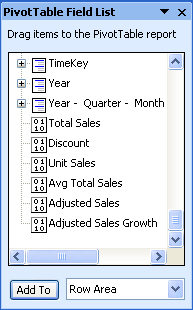
Adding Fields
If the interface
and environment you’re now in seems familiar, it should: The cube
browser hosted by both SQL Server Management Studio and the Visual
Studio Analysis Services project cube designer uses a modified version
of the Excel PivotTable. You can distinguish measures from both
hierarchies and attributes by the measures’ distinct icons (which depict
zeroes and ones), as shown in Figure 7.
You can drag and
drop hierarchies and attributes from the Field List to the Row Fields,
Column Fields, and Page Fields areas, and you can drag and drop measures
to the Data Items area in the PivotTable much as you can in the cube
browser. You can also add an item by selecting it in the PivotTable
Field List window, selecting a target drop area from the drop-down list
at the bottom of the window, and then clicking the Add button to its
left. Multiple items can be “stacked” in the same area, and you can
remove items by dragging and dropping them outside the physical
boundaries of the PivotTable.
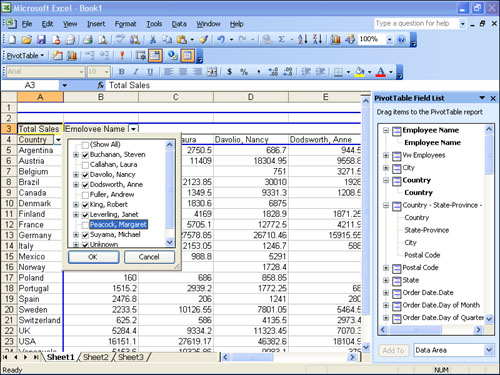
Filtering and Drilling Down
After
dragging hierarchies or attributes into the Rows, Columns, or Pages
areas, you can click the drop-down arrow next to the level or attribute
name to reveal a list of members, any of which you can select or
deselect (Figure 8).
You can also double-click any member to drill down on it. Again, these
features are similar to features offered by the cube browser. In fact,
dragging items into the Page Fields area and picking a specific member
in its drop-down list allows you to use this area within the PivotTable
as you would use the cube browser’s Filter Fields area.
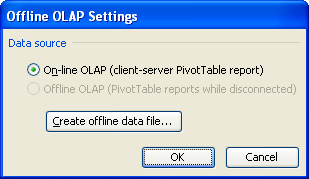
Offline Cube Files
The
PivotTable toolbar (which should appear automatically) provides a number
of tools and options for customizing the look and content of your
PivotTable. Of particular interest is the Offline OLAP option on the
PivotTable drop-down button (the first toolbar button on the left). Selecting this option brings up the Offline OLAP Settings dialog box (Figure 9).
You can click the Create Offline Data File... button in the dialog box
to open the Create Cube File dialog box (which is actually a wizard; see
Figure 10).
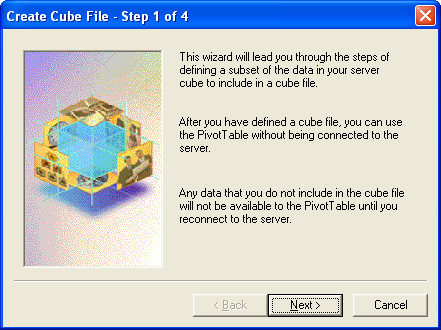
This wizard is an
extremely important tool: On its Step 2 page, you can pick a subset of
the cube’s dimension objects (hierarchies, levels, or attributes), and
on the Step 3 page you can select a subset of the cube’s measures and
members of the dimensions you chose on the Step 2 page. The Step 4 page
lets you save the selected cube subset to an offline cube file (with a
.cub extension). Offline cube files can be queried directly by
PivotTables and by ADO MD .NET (just use the filespec in the data
source= section of your connection string), allowing you to work with
your OLAP data even when you’re disconnected from Analysis Services.
Caution
When
you connect to offline cube files from Excel, in the Multidimensional
Connection 9.0 dialog box select Cube File instead of Analysis Server
and manually supply the full path
to your cube file. If you select the file using the ellipsis (...)
button and the File Open dialog box, only the file name will be inserted
and you will be unable to connect. |
In addition to
generating the .cub file, the Create Cube File dialog box places in the
same folder a text file called SlicerDDL.txt, which contains the MDX
query used to create the .cub file.
Such queries can be executed directly from your own applications or
from SQL Server Management Studio’s MDX Query window, which means that
Excel is not required to generate offline cube files (even though it can
connect to offline files created outside Excel). See the
OfflineFile.mdx file in the Management Studio sample solution’s MDX
Demos project for a sample of such a query.
Creating and Configuring Charts
After you’ve put some
work into your PivotTable, you’ll see that the numbers it presents and
the format are quite usable. Still, with OLAP data, visualization is
often key to users’ immediate comprehension of the data presented.
Luckily, Excel makes it uncannily easy to present a PivotTable’s data
graphically. To see this for yourself, start by right-clicking any cell
in the PivotTable and selecting PivotChart from the shortcut menu. Excel
immediately creates a stacked column chart, on its own tab, from the
data displayed.
Tip
To
view a PivotTable’s data graphically, you can also do any of the
following: Click the ChartWizard button (the third button from the left)
on the PivotTable toolbar; click the PivotTable drop-down button (far
left) on the PivotTable toolbar and then select the PivotChart option
from the drop-down menu; or choose Insert/Chart... from Excel’s main
menu. |
The stacked column
chart is useful, but a different chart type will likely be more helpful.
To change the chart type, simply click the chart and choose Chart/Chart
Type... from the Excel main menu or right-click on the chart and choose
Chart Type... from the shortcut menu. Either action will invoke the
Chart Type dialog box (Figure 11).
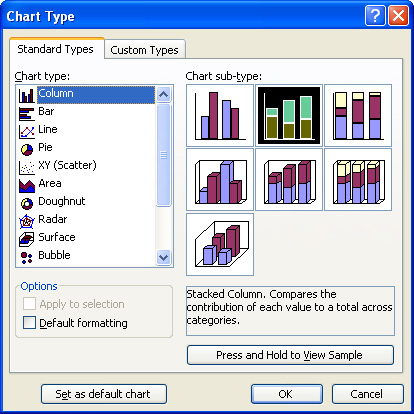
For
a more interesting chart, pick the Line option (third from the top)
from the Chart Type list, and then choose 3-D Line (the last option)
from the Subtype menu and click OK. You should see a chart similar to
that shown in Figure 12.
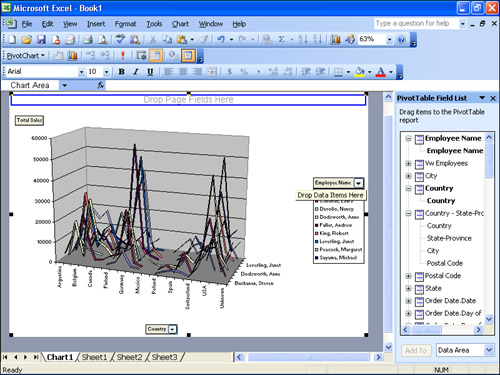
Charts provide
impressive visual output, and they are as configurable as PivotTables.
In other words, with the PivotTable Field list showing, you can drag and
drop dimensions and measures onto and off your chart (to/from its Data
Items, Series, and Category areas) instead of the PivotTable it is
linked to. If you flip back to the PivotTable after making changes to
the chart, you will see your changes reflected in the PivotTable.
Experiment a bit more and you’ll discover that the converse is true as
well.
As you can see,
PivotTables make Excel an able OLAP client. Virtually all the
capabilities of the cube browser are available within it, which offers a
familiar environment for many users. Those features, combined with the
ubiquity of Excel, make Excel a tempting deployment vehicle for your
OLAP needs.