Half of performance tuning is finding the problem.
System Monitor (also known as Performance Monitor or PerfMon) is a
performance monitoring tool provided by Windows that can be useful when
measuring hardware performance or bottlenecks and when identifying a
process on a server causing a slowdown. If SQL Server is running on a
shared server (perhaps with a third-party application or Web server such
as Internet Information Services), System Monitor can help you find the
process consuming resources. If a server is dedicated to SQL Server or
System Monitor identifies SQL Server as the cause of the problem, there
is a more limited set of counters available for troubleshooting. System
Monitor provides a server-wide overview, and it isn’t possible to see
exactly what SQL Server is doing at any point in time, which becomes
useful when tracing.
As the performance
tuning process becomes more focused, it is necessary to get visibility
of activity within SQL Server, and this is when you need tracing.
Tracing provides the ability to collect data about Transact-SQL (T-SQL)
commands and Multi-Dimensional Expressions (MDX) executed on a database
server. Additionally, it is possible to trace for information about
events affecting system performance such as deadlocks, warnings, data
and log file shrinks/ grows, and blocked processes. Tracing can also
gather information about the way SQL Server processes requests
internally such as locks, lock escalation, and query execution plans.
SQL Server Profiler (known as
SQL Profiler or, simply, Profiler) is the graphic tool installed
alongside SQL Server used to define, configure, and start/ stop traces.
SQL Server Profiler can be found by selecting Start > All Programs > Microsoft SQL Server 2008 > Performance Tools > SQL Server Profiler.
Once Profiler is launched, you need to create a new trace. To create a trace, either select File > New Trace
or click the left-most icon from the toolbar. The Server Connection
Dialog window appears: specify the name of the server and SQL Server
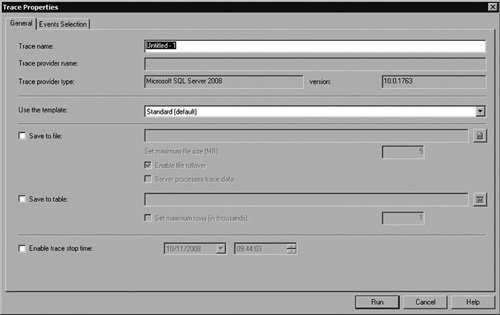
instance to be traced and connection credentials. After successfully
connecting to an instance of SQL Server, the Trace Properties window
appears (see Figure 1).
You can provide a name that describes the trace and select options that
give you control over how trace data is stored and what data is
captured.
Trace Templates
The next configuration
option is trace template (the Standard template is select by default).
Trace templates provide a preconfigured trace definition for common
trace scenarios. It is possible to create new trace templates or modify
those provided with SQL Server. It is usually possible to start with a
template and adjust the events and filters based on your needs. Table 1 contains a summary of trace templates, when you might use them, and the events captured.
Table 1. Trace Templates Summary
| Name | Description | Events |
|---|
| SP_Counts | Used to trace calls to start Stored Procedures. |
SP:Starting
|
| Standard | Captures data to provide instance overview including T-SQL Statement and Stored Procedure Start and Completion. |
Audit Login Audit Logout ExistingConnection RPC:Completed SQL:BatchCompleted SQL:BatchStarting
|
| TSQL | This
template captures T-SQL batch start times; useful for troubleshooting
client application performance and correlating data captured from
applications with SQL Server events. | Audit Login Audit Logout ExistingConnection RPC:Starting SQL:BatchStarting
|
| TSQL_Duration | Records all T-SQL Statements and the duration to complete. |
RPC:Completed SQL:BatchCompleted
|
| TSQL_Grouped | Useful for capturing activity about a specific user or application; this template groups T-SQL commands by User or Client. | Audit Login Audit Logout ExistingConnection RPC:Starting SQL:BatchStarting
|
| TSQL_Locks | Captures
all Transact-SQL statements submitted to SQL Server by clients along
with exceptional lock events. Use to troubleshoot deadlocks, lock
time-out, and lock escalation events. |
Blocked Process Report SP:StmtCompleted SP:StmtStarting SQL:StmtCompleted SQL:StmtStarting
|
| | |
Deadlock Graph (Use against SQL Server 2005 or SQL Server 2008 instance)
|
| | |
Lock:Cancel
|
| | |
Lock:Deadlock
|
| | |
Lock:Deadlock Chain
|
| | |
Lock:Escalation
|
| | |
Lock:Timeout (Use against SQL Server 2000 instance)
|
| | |
Lock:Timeout (timeout>0) (Use against SQL Server 2005 or SQL Server 2008 instances)
|
| TSQL_Replay | Use
this template if the trace is to be replayed. Captures all events
necessary to recreate statements/workload on a different server. | CursorClose CursorExecute CursorOpen CursorPrepare CursorUnprepare Audit Login Audit Logout Existing Connection RPC Output Parameter RPC:Completed RPC:Starting Exec Prepared SQL Prepare SQL SQL:BatchCompleted SQL:BatchStarting
|
| TSQL_SPs | Useful
for troubleshooting poorly performing Stored Procedures; this template
captures each step within the stored procedure to display execution
duration. | Audit Login Audit Logout ExistingConnection RPC:Starting SP:Completed SP:Starting SP:StmtStarting SQL:BatchStarting
|
| Tuning | This template captures T-SQL completion times; used to pass to SQL Server Database Tuning Advisor for analysis. | RPC:Completed SP:StmtCompleted SQL:BatchCompleted
|
Warning
Be sure you have a good
idea of what’s included in the trace templates. You should especially
take note of the Replay template, which is used to make a trace capture
for replaying on a test server.
After choosing a trace template, you can click Run
and server activity will begin to fill the screen. This can be useful
to verify that the required events are being captured or to monitor SQL
instances where activity is low (perhaps on a development workstation or
test server where workload is restricted). However, reading and
analyzing results captured through Profiler directly to the screen can
become unwieldy on a server with even a moderate load. In this
situation, consider tracing to a flat file or database table, which will
speed up the trace and allow for post-capture analysis.
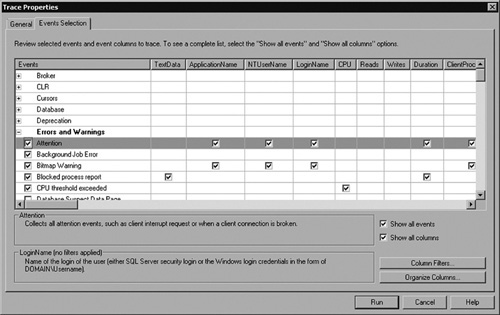
Trace Events
Select the Events Selection
tab at the top of the Trace Properties window to view and control the
event classes captured when a trace is running. The events already
selected are those specified in the trace template. Click the Show All Events and Show All Columns
check boxes at the bottom right to display all events and options
available for capture. You can choose any event necessary to include in
the trace definition. Figure 2
shows some useful events to include in each trace such as Errors and
Warnings, which alerts you to a number of conditions you should be aware
of when troubleshooting any SQL Server problem.
|
SQL traces affect server
performance. Trace as few events as necessary; you’ll save overhead and
capture less data to analyze! Exercise particular caution when
capturing events in the LOCK event class since a busy SQL Server may
acquire and release many thousands of locks per minute.
|
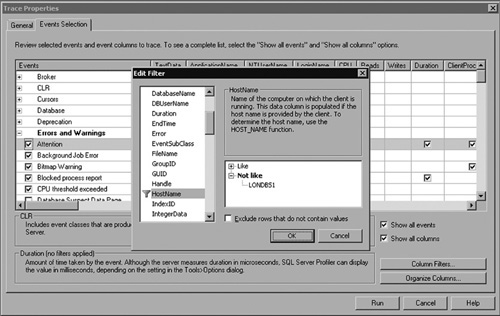
Trace Filters
Trace
filters allow restrictions to be applied on the data captured by a
trace. This can be useful with particularly busy or shared servers to
capture activity for a single user, database, or application. Filters
can be applied to include (Like) or exclude (Not Like) trace data.
To apply a filter, click the Column Filters button at the bottom right of the Trace Properties window and select the column you wish to filter. In the example shown in Figure 3, all requests from server LONDBS1 are excluded from the SQL trace.
Server-Side Tracing
Server-side
tracing reduces the impact of tracing and is recommended when tracing
busy production servers or machines where system resources (memory or
CPU) are low. Additionally, when traces are run from the server itself
there is no network
time involved in reporting start times for query execution. Since
network time can vary (e.g., latency due to traffic of other network
users), tracing across a network can produce inconsistent results.
There are two methods to
create a server-side trace: as always a family of stored procedures is
provided, but these can be cumbersome and difficult to translate to
actual events and columns. It is possible to create a trace within
Profiler and then script the trace definition. To script the trace
definition, select File > Export > Script Trace Definition > For SQL Server 2005 – 2008.
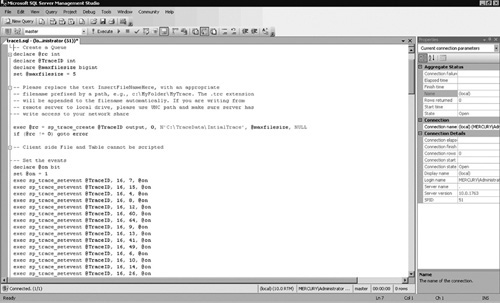
After you open the
trace definition in SQL Server Management Studio, you’ll see the
sp_trace_create statement, which is used to define the trace. Here
you’ll need to replace InsertFileNameHere with the path to the folder
where trace files should be saved (see Figure 4).
Try to avoid tracing to system drives or those where data or log files
are stored because this type of tracing will affect performance of the
database server.
|
Try
to place trace files on dedicated disks that will have enough capacity
for the duration of a trace. Avoid storing trace files on system drives;
if the drive does fill, recovering a server from a full system
partition is more difficult and time consuming that if a non-system
partition fills.
|
Once the destination is
configured, run the script and make a note of the TraceID returned by
the query. The trace is now defined on the server; however there’s an
additional step required to start the trace. The system stored procedure
sp_trace_setstatus is used to control the trace and requires parameters
TraceID and status. Table 2 shows the status parameters to control server-side traces. In order to start TraceID 2, you must run sp_trace_setstatus(2,1).
Table 2. Status Parameters to Control Server-Side Traces
| STATUS | DESCRIPTION |
|---|
| 0 | Stop trace |
| 1 | Start trace |
| 2 | Close trace and remove trace definition |
Finally, if you lose
track of which traces are running on a server, run select * from
fn_trace_getinto(null) to return details of all traces. Remember that
unless you’ve disabled it, there’s a default trace (TraceID 1) running
at all times to populate the Dynamic Management Views (DMVs).
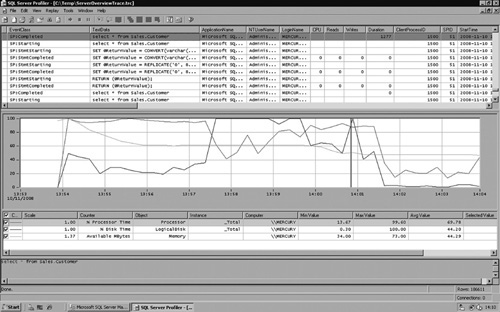
Combining System Monitor and Profiler Traces
First
introduced with SQL Server 2005, this excellent feature of Profiler
allows administrators to combine a System Monitor trace with a SQL
trace. This presents a single view of system resources (disk, memory,
and CPU) with the statements executing at the time enabling
administrators to, for example, correlate high-CPU conditions with a
specific stored procedure or T-SQL statement.
Figure 5
shows the timeline from System Monitor that allows a view of hardware
utilization: the red vertical bar allows administrators to jump to a
particular point (e.g., a CPU spike) and the trace can identify the
T-SQL command running at the moment of the spike.
Replaying Traces
SQL Server
provides the ability to replay traces. Typical scenarios involve
capturing a trace from a production server and replaying the trace
against a test or preproduction server. This can help when evaluating
changes and also with some troubleshooting
scenarios. Each statement captured in the trace is replayed against the
target server, which can be helpful in verifying that a fix implemented
on a test server actually resolves the problem.
A minimum set of events
are required for trace playback; alternately, use the Replay trace
template. Not all servers can be traced and replayed; for example, if a
server is participating in transactional replication, trace replay isn’t
possible because of the way transactional replication marks
transactions in the log.
|
Capturing trace data on a
busy server many generate many gigabytes of data. Using a server-side
trace writing to a file on a local disk minimizes tracing overhead.
However, unless you’re looking for a specific event in the trace, often
the best way to manage the data is to load the trace data from a flat
file into a table. The following function loads trace data from a file
into a table:
SELECT * INTO srv1_trace FROM ::fn_trace_gettable
('c:\temp\trace1.trc', default)
Once the data is in a database, analysis with TSQL queries is much easier!
|
Using SQLDiag to Collect Performance Data
SQLDiag is a command
line data collection utility first supplied with SQL Server 2005 that
can useful for collecting performance data. SQLDiag collects the
following:
Windows event logs
SQL Server configuration details
System Monitor performance logs
SQL Server Profiler trace data
SQL Server blocking information
Essentially,
SQLDiag doesn’t do anything that couldn’t be achieved separately: -
each of these tools could be run independently, however, SQLDiag makes
it easier to start and stop data collection and ensures all relevant
information is collected each time data capture is run.