SharePoint
administrators need to know how to proficiently monitor SQL Server
performance and storage in SharePoint environments. Understanding
monitoring strategies and tools enables administrators to shift from
reactively dealing with issues to proactively troubleshooting and fixing
problems before the server gets to the point where end users are
impacted. This section walks administrators though a range of monitoring
tools they should be aware of to efficiently and powerfully monitor,
maintain, and troubleshoot SQL Server in SharePoint environments. Topics
include WMI, Event Logs, Dynamic Management Views, Reliability and
Performance Monitor, Activity Monitor, and Management Data Warehouse.
With a vast range of monitoring tools available, choosing the right tool
for the job is an important skill.
Windows Management Instrumentation
Windows Management Instrumentation
(WMI) is a Microsoft implementation of Web-Based Enterprise Management
(WBEM), an industry initiative that establishes management
infrastructure standards. WMI supplies administrators with the tools to
explore, understand, and use various system devices, resources, and
applications of Microsoft operating systems and servers. WMI includes a
rich infrastructure that enables efficient and scalable monitoring, data
collection, and problem recognition. Think of WMI as a set of
functionalities embedded into Microsoft operating systems and servers,
including SQL Server, that enables local and remote monitoring and
management.
WMI is a huge
initiative and certainly deserves an entire book of its own. However,
what administrators need to know is that the architecture of WMI enables
extensibility through the use of providers, which are Dynamic Link Library files that interface between WMI and software or hardware components.
Each provider contains a set of
WMI classes. Each WMI class represents a manageable entity, exposes
information through properties, and enables the execution of some
actions via methods. Because a provider is designed to access some
specific management information, the WMI repository is logically divided
into several areas called namespaces. Each namespace contains a set of providers with their related classes specific to a management area.
Administrators should also know
that SQL Server, as part of its installation process, adds two
providers to the WMI repository (WMI Provider for Configuration
Management and WMI Provider for Server Events):
The WMI
Provider for Configuration Management enables administrators to use WMI
to manage SQL Server services, SQL Server client and server network
settings, and server aliases. For example, after a connection is
established with the WMI provider on a remote computer, not only is it
possible to retrieve information about SQL Server instances, but it’s
also possible to perform actions on them such as starting and stopping
the instances.
The
WMI Provider for Server Events enables administrators to use WMI to
monitor events in SQL Server. Included are Data Definition Language
(DDL) events that occur
when databases are created, altered, or dropped and when tables are
created, altered, or dropped, for example. In addition, software
developers can write code that responds to these events, and they can
even author their own set of monitoring tools. Administrators can also
create a SQL Server Agent alert that is raised when a specific SQL
Server event occurs that is monitored by the WMI Provider for Server
Events.
It’s worth mentioning
that WMI enables scripting languages such as VBScript or Windows
PowerShell or even the WMI command-line utility (Wmic.exe) to manage
local and remote servers. This enables administrators to query this huge
amount of management information through a SQL-like language called the
WMI Query Language (WQL).
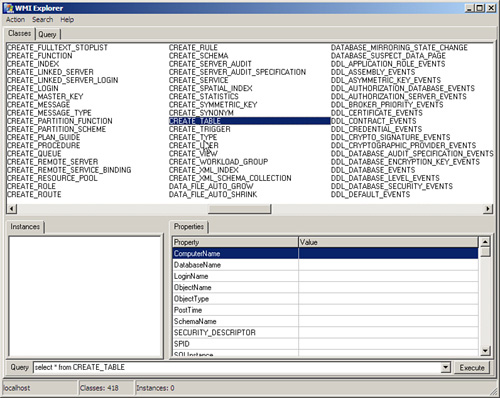
To explore the available namespaces, classes, and events, administrators can use a tool such as the WMI Explorer shown in Figure 1.
Event Logs
An additional aspect of
monitoring often disregarded by some administrators is monitoring the
various log files available. SQL Server logs certain system events and
user-defined events to the SQL Server error log and the Microsoft
Windows application log.
Administrators can use
information in the SQL Server error log to troubleshoot problems related
to SQL Server. Browsing the SQL Server logs for irregular entries is an
essential administration
task; preferably, it should be carried out on a daily basis to help
administrators spot any current or potential problem areas. An
application-aware solution such as Microsoft’s System Center Operations
Manager (SCOM) can help to automate the process of monitoring SQL (and
SharePoint) logs.
SQL Server error log files
are simple text files stored on disk, but it is good practice to
examine them by using SQL Server Management Studio or by executing the
xp_readerrorlog extended stored procedure to prevent any SQL operations
from being blocked by opening one of these files in a text editor.
A new error log file is
created each time an instance of SQL Server is started; however, the
sp_cycle_errorlog system stored procedure can be used to cycle the error
log files without having to restart the instance of SQL Server.
The Windows application
log describes events that occur on the Windows operating system and
other events related to SQL Server and SQL Server Agent. Administrators
can use the Windows Event Viewer to view the Windows application log and
to filter the information. These event logs should be another place
that administrators go to look for information about any issues that
take place with SQL Server.
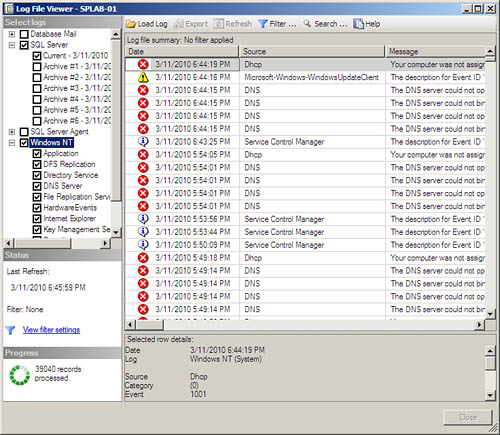
In the past, administrators had
to view the SQL Server and Windows event logs independently; however,
the SQL Server Management Studio Log File viewer makes it possible for
administrators to combine both sets of logs into a united view.
Using the SQL Server Log File Viewer
The following steps show how to view the log files using SQL Server Management Studio:
1. | Click Start, All Programs, Microsoft SQL Server 2008 R2, SQL Server Management Studio.
|
2. | Connect to the desired SQL Server database engine instance and expand that instance.
|
3. | In Object Explorer, expand Management.
|
4. | Right-click SQL Server Logs, click View, and then select either SQL Server Log or SQL Server and Windows Log.
|
5. | Double-click any log file, such as the one shown in Figure 2.
|
Log File Cycling
One thing administrators
should keep in mind is that in production environments, log files can
get quite large and take a long time to open. To avoid huge log files,
it is a good idea to cycle them on a regular basis. Restarting the SQL
Server service is not good practice. Alternatively, the log file can be
automatically cycled using the sp_cycle_errorlog system stored
procedure. The more writes to the error log, the more often it should be
cycled. To automate the log cycling process, administrators can utilize
the SQL Server Agent to create a new agent job with a single T-SQL task
to execute the stored procedure, or they can include it in a regular
daily or weekly maintenance plan.
Number of Log Files to Maintain
To keep as much
historical information as possible, it is recommended that
administrators configure the number of log files to be retained; this
number depends on the amount of disk space available and the amount of
activity on the server.
The following steps show how to configure the number of log files to be retained:
1. | Click Start, All Programs, Microsoft SQL Server 2008 R2, SQL Server Management Studio.
|
2. | Connect to the desired SQL Server database engine instance and expand that instance.
|
3. | In Object Explorer, expand Management.
|
4. | Right-click SQL Server Logs, and click Configure.
|
5. | As shown in Figure 3,
check the box to limit the number of error logs created before they are
recycled. SQL Server retains backups of the previous six logs, unless
you check this option and specify a different maximum number of error
log files.
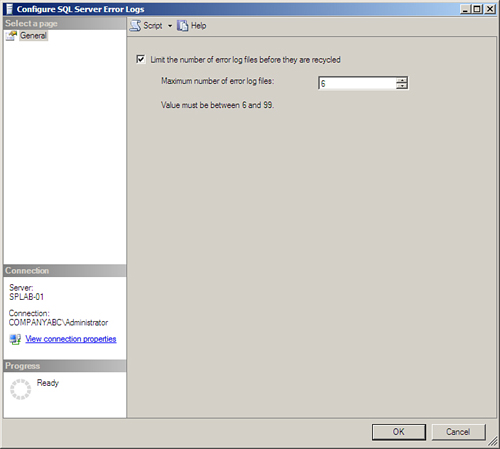
|
6. | Specify a different maximum number of error log files, and click OK.
|
Dynamic Management Views
Another
area to retrieve monitoring information is the Master database; this is
where SQL Server stores most of its configuration information. It is
not a good idea to directly query the master database, because Microsoft
could change the structure of the master database from version to
version or even in service pack releases. Rather than developers
building solutions that rely on the Master database schema and risking
any changes in a service pack messing up the solution, Microsoft instead
has created a set of dynamic management views and functions.
Dynamic management
views and functions return valuable information that can be used to
monitor the health of a server instance, diagnose problems, and tune
performance. They give administrators an easy way to monitor what SQL
Servers are doing and how they are performing by providing a snapshot of
the exact state of the SQL Servers at the point they are queried. They
replace the need to query the system tables or to use other inconvenient
methods of retrieving system information in use prior to SQL Server
2005. SQL Server 2005 introduced DMVs, and the latest release, SQL
Server 2008 (and SQL Server 2008 R2), includes additional useful DMVs.
Whenever an instance is
started, SQL Server starts saving state and diagnostic data into DMVs.
When an instance is restarted, the information is flushed from the
views, and new data begins to be loaded.
DMVs
and functions are part of the sys schema in the master database.
Administrators can find a list of dynamic views in SQL Server Management
Studio under Master/Views/System Views, and the dynamic functions are
located under Master/Programmability/Functions/System
Functions/Table-valued Functions. Each dynamic object’s name has a dm_
prefix.
For example, the sys.dm_db_index_physical_stats
dynamic management function will be used to determine the fragmentation
percentage of the indexes for efficient database maintenance.
Reliability and Performance Monitor
One of the Windows tools
administrators should be skilled at using is the Reliability and
Performance Monitor. Administrators who used perfmon
in Windows Server 2003 may find the Reliability and Performance Monitor
in Windows Server 2008 (the tool is called just Performance Monitor in
Windows Server 2008 R2) a bit confusing when they first explore it.
However, in addition to all the features included in previous versions,
it now presents some new functionality that can make performance
troubleshooting much easier and powerful because it provides a more
detailed view of Windows server performance and per-instance SQL
Server-specific counters.
The Reliability and
Performance Monitor can monitor resource usage for the server and
provide information specific to SQL Server either locally or for a
remote server. It provides a massive set of counters that can be used to
capture a baseline of server resource usage, and it can monitor over
longer periods to help discover trends. It can also detect abnormal
values at a glance for key performance counters on critical SQL Server
instances. Additionally, administrators can configure it to produce
alerts when preset thresholds are surpassed.
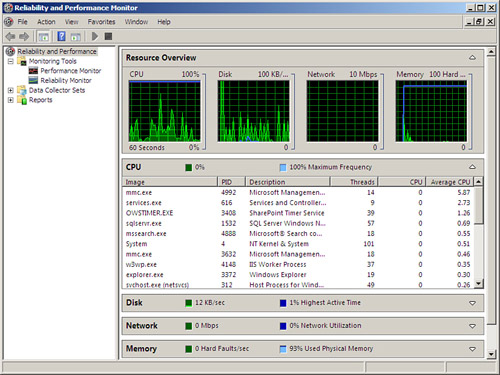
After opening the Reliability and Performance Monitor, as shown in Figure 4,
the % Processor Time counter from the Processor object is automatically
monitored in real time with a 1-second refresh interval. Additional
counters can be appended to the graph by clicking the green plus icon on
the toolbar and navigating through objects, which classify the counters
into groups. When a SQL Server instance is installed on a server, it
adds more than 1,000 new performance counters to the Performance Monitor
section of the Reliability and Performance Monitor. Of the many
performance counters that can be selected when troubleshooting a SQL
Server instance, choosing the appropriate key indicators can
significantly help administrators quickly isolate bottlenecks and direct
their investigation to the appropriate resources for corrective
actions.
Additionally, administrators
can capture performance counters to log files for long-term analysis by
creating Data Collector Sets.
Activity Monitor
Undoubtedly, the Reliability
and Performance Monitor is a great tool for administrators to monitor
resource usage; however, an administrator should first leverage the SQL
Server Activity Monitor, as shown in Figure 5, when needing to gain some quick insight into a SQL
Server system’s performance. In SQL Server 2008, the Activity Monitor
introduced a new performance dashboard with intuitive graphs and
performance gauges with drill-down and filtering capabilities. The new
tool’s look and feel is similar to the Reliability and Performance
Monitor, but the information captured is broken down into five main
sections dedicated to SQL Server performance monitoring.
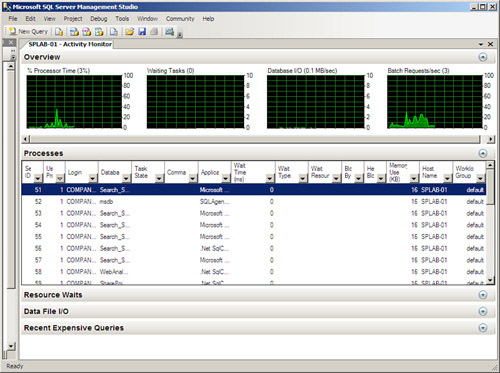
The sections are
Overview, Processes, Resource Waits, Data File I/O, and Recent Expensive
Queries. In SQL Server 2008 R2, right-clicking a SQL Server instance
within Object Explorer and specifying the Activity Monitor will launch
the tool, as shown in Figure 9.5.
Overview—
Shows the graphical display of Processor Time (%), Number of Waiting
Tasks, Database I/O (MB/Sec), and the Number of Batch Requests/second.
Processes—
Lists all the active users who are connected to the SQL Server database
engine. This is beneficial for administrators, because they can click
any of the session IDs, run a SQL Server Profiler trace to capture all
its activities, or even kill a specific process.
Resource Waits—
Displays resource waits vertically based on the following wait
categories: CPU, SQLCLR, Network I/O Latch, Lock, Logging, Memory,
Buffer I/O, Buffer Latch, and Compilation. From a horizontal
perspective, the Wait Time, Recent Wait Time, Average Waiter Counter,
and Cumulative Wait Time metrics are published for each Wait Category.
Analogous to the Processes section, data can be filtered based on items
within a column.
Data File I/O—
Displays disk-level I/O information related to all the data and log
files of user and system databases. Administrators can use this to
rapidly recognize databases that are performing badly because of disk
bottlenecks.
Recent Expensive Queries—
The last section in Activity Monitor is Recent Expensive Queries. This
section gives administrators the opportunity to capture the queries that
are performing the worst and negatively influencing a SQL Server
instance. Approximately 10 to 15 of the worst and most expensive queries
are displayed in the performance dashboard. The actual query is
displayed with augmenting metrics such as Execution in Minutes, CPU
ms/sec, Physical Reads/sec, Logical Write/sec, Logical Reads/sec,
Average Duration in ms, and Plan Count. It is also possible to
right-click the most expensive query and show the execution plan.
Data Collectors
The Management Data
Warehouse provides administrators with a simple mechanism to track
statistics over time. By implementing the Management Data Warehouse,
administrators can monitor performance and do trend analysis for the SQL
Server 2008 R2 instances they manage.
The Management Data
Warehouse is a relational database inside the SQL Server 2008 R2
instance that holds a variety of performance-related statistics. The
performance statistics in the Management Data Warehouse are gathered via special data-gathering routines, known as data collections.
The Management Data Warehouse can include data collection information
from a sole instance or can alternatively hold data collected from
multiple instances. The data collection process depends on prebuilt SSIS
routines and SQL Server Agent jobs, which diminishes the number of
things administrators need to do to build and maintain a database that
contains performance statistics.
SQL Server 2008
R2 provides three different system data collection definitions. These
data collections are Disk Usage, Query Activity, and Server Activity.
Each of these data collection definitions identifies the data to be
collected, how often it should be collected, and how long it should be
kept in the Management Data Warehouse.
Data collections can
be run manually, can be run on a schedule, or can be run continually.
Manual and scheduled data collections collect and upload data into the
Management Data Warehouse on the same schedule. These types of data
collections are known as noncached
collections. When a data collection runs continually, data is cached in
a directory and then uploaded to the Management Data Warehouse from
time to time. These are known as cached collections.
It is also worth
mentioning that Microsoft has also provided standard reports to enable
administrators to drill down into data gathered for each of these
collections using SQL Server Management Studio.