2. Connection Pooling
Connection pooling is an important consideration for performance.
Although this statement is generally accurate in the world of database
programming, it becomes critical for SQL Azure. A poorly designed
application may create too many connection requests, which can end up
flooding SQL Azure. If too many connection requests are established,
your connections will be throttled, meaning that you can no longer connect for a period of time.
NOTE
Tests confirm that a SQL
Azure database becomes unavailable for more than a minute if you quickly
issue in excess of 50 distinct database connections. After the same
test was run multiple times, the database became unavailable for a few
hours.
As you can see, you need
to minimize the creation of database connections, which you can achieve
through proper connection pooling. First, you should know that
connection pooling is affected if any part of the connection string is
changed (even slightly), such as the application name or the login id
(UID). A new connection pool is created even if you change the order of
the parameters of a connection string. For example, if you have an
application that performs three database operations, and the operations
use the following connection strings, respectively, three pools are
created, and hence three distinct database connections in SQL Azure on
the same database:
Server=XYZ;Initial Catalog=DB1;UID=hroggero;PWD=123456
Server=XYZ;Initial Catalog=DB1;PWD=123456;UID=hroggero
Server=XYZ;Initial Catalog=DB1;UID=hroggero;PWD=123456;Application Name=MyApp
To ensure that the same
database connection is used, you must ensure that the three operations
use the exact same connection string:
Server=XYZ;Initial Catalog=DB1;UID=hroggero;PWD=123456
Server=XYZ;Initial Catalog=DB1;UID=hroggero;PWD=123456
Server=XYZ;Initial Catalog=DB1;UID=hroggero;PWD=123456
To measure the number of
database connections open on a given database, you can use the
sys.dm_exec_connections management view. A row is returned for each
distinct database connection; the fewer rows, the better!
3. Execution Plans
Sometimes you need to dig deeper
and understand how SQL Azure fetches data, and then use that
information to improve performance. In SQL Server, you can also use
execution plans to observe the impact of changes to the underlying
hardware, such as changing memory configuration. Although you have no
control over configuration settings with SQL Azure, execution plans can
still be very useful to see the impact of your indexes and to view which
physical operators are being used.
Whereas logical operators are used in a SQL statement, such as LEFT JOIN, physical operators
tell you which technique SQL Azure is using to solve a given logical
operation or to fetch additional data. The most common physical
operators SQL Azure uses to represent JOIN operations are listed in Table 3.
Table 3. Physical JOIN operators
| Operator | Symbol | Comment |
|---|
| Nested loop |  | A loop is performed in SQL Azure to retrieve data. For each record in Table 1 matching the WHERE clause, find the matching records in Table 2. On large recordsets, loops can be costly. |
| Hash match |  | A hash is calculated for each record in each table participating in a JOIN, and the hashes are compared for equality. |
| Merge |  | Merge
operators are usually the fastest operators because they perform a
single pass of the tables involved by taking advantage of the order in
which the data is stored or retrieved. |
You can give SQL Azure certain
hints to use a specific physical operator, but using them isn't
generally recommended. You have three proper ways to influence SQL Azure
to select an effective physical operator:
Review your WHERE clause. This is perhaps the most overlooked aspect of performance tuning. When you have the choice, applying the WHERE clause on the tables that have the most rows gives you new opportunities for indexing.
Optimize your database design. Highly normalized databases force you to create more JOIN statements. And of course, the more JOIN
statements, the more tuning you need to do. You shouldn't plan to have a
database design at first normal form; however, in certain cases,
denormalizing has its benefits.
Create better indexes.
Having a good indexing strategy is important. The order of your columns
and the number of columns can make a world of difference for SQL Azure.
NOTE
To run the following examples, you need to execute the Tuning.sql script. It creates a few sample tables with test data. Make sure to select a user database when running this script.
To show which physical JOIN
operators have been selected, execution plans provide insights into the
volume of data being worked on and the relative cost of certain
operations. For example, execute the following SQL statement (after
running the tuning.sql script):
SELECT T.Name, T.UserType
FROM TestUsers T INNER JOIN TestUserType UT
   ON T.UserType = UT.UserType
WHERE T.AgeGroup > 0 AND UT.UserTypeKey = 'Manager'
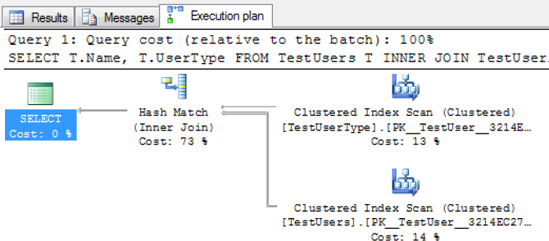
This statement returns 25
rows. To view the execution plan, you need to request it before running
the statement. Either press Ctrl + M or choose Query → Include Actual
Execution Plan from the menu in SQL Server Management Studio, and re-run
the SQL statement. You should now see an Execution Plan tab. Click the
tab to see output similar to that shown in Figure 2.
In order to fully understand the previous execution plan, let's review additional symbols often seen in execution plans. Table 4 shows a few symbols that have clear performance implications.
Table 4. Lookup, index scan, and index seek operators
| Operator | Symbols | Comment |
|---|
| Lookup |  | Lookups
can be costly when the statement returns thousands of rows and a lookup
is needed for every row. If you determine that the lookup is costly,
consider creating a covering index. |
| Index scan |  | An index or clustered index scan may or may not be a bad thing. Scanning
means that SQL Azure reads all the records sequentially in the index.
Scanning isn't good for performance if you return a fraction of the
records being scanned, in which case an index is needed. But if you want
to return all the records from a table, a scan is necessary. |
| Index seek |  | An index or clustered index seek means the first record matching the query is found quickly, without scanning. |
Execution plans can show many
other symbols that have very specific meanings, including hints that a
query is using multiple processors, and so on.
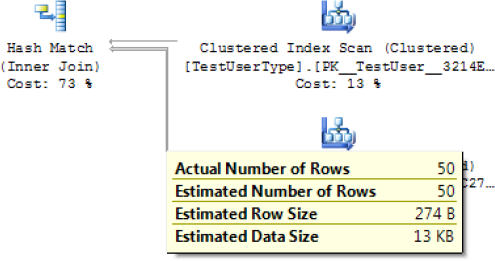
Because no indexes are defined on the underlying tables and the execution plan in Figure 2 shows two index scans, you have a potential performance problem. The INNER JOIN
logical operator is executed with a hash match physical operator. You
can see a thicker line coming into the hash match; hovering your cursor
on this line shows you that 50 records are being consumed by the JOIN operation (see Figure 3).
Also, you can see that a clustered index scan is being used to fetch
data for both tables. Finally, note that the hash match operation
consumes 73% of resources of the entire statement; this means it takes
more time to JOIN the records than to read the data from disk.
In summary, the statement you've been working with has three potential issues:
Index scans. An index scan is performed on both tables, causing more reads than necessary.
Heavy operator processing. The hash match operation is consuming most of the processing time.
More reads than records returned. As you can see from Figure 12-3,
the statement is processing 50 records but returning only 25. This may
be a hint that you're reading more records than necessary. However, this
isn't always a problem in itself—just something to keep an eye on.
NOTE
For those familiar with
heap tables, SQL Azure doesn't allow them. If you intend to insert
records into a table, a primary key must be defined on the table.
You see shortly how
indexing can help you tune this statement. But before leaving the topic
of execution plans, it's important to be familiar with a few more
points:
Relative query cost. Notice in Figure 2,
shown earlier, that near the top of the window, a query cost is
displayed. This is a relative measure compared to all the other
statements being executed as a batch. In this example, the value is 100%
because it's the only statement. You should know, however, that this
value can be misleading. It's calculated dynamically by SQL Server
Management Studio based on estimated costs, not actual costs. As a
result, this value is rarely accurate.
Advanced calls.
Certain operations, such as XML calls and using functions in your SQL
statements, are usually misrepresented in an execution plan; as such,
SQL Azure (and even SQL Server) may return 1% as a cost for those
operations. This may lead you down the wrong path when tuning your SQL
statements.
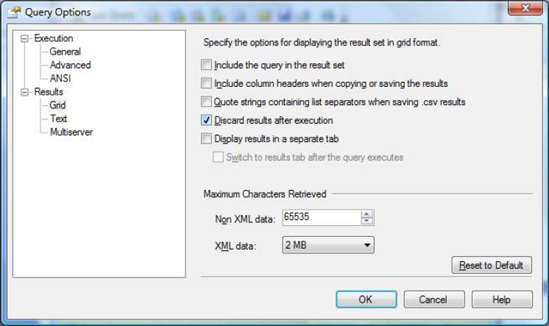
Discarding output.
As discussed previously, the duration (as measured by
sys.dm_exec_sessions) includes display time, and that applies to SQL
Server Management Studio. To minimize the time it takes to display the
data, you can disable the output by checking the necessary settings in
Query → Query Options. The same option appears in two places: in the
Grid and Text Results. Figure 4 shows how to disable the output from the Grid display.