One
interesting feature added in SQL Server 2005 is the ability to import
performance logs into SQL Server Profiler so that you can correlate
activity on the system to specific queries. Correlating performance
monitor (PerfMon) logs with SQL Server Profiler traces drastically
improves your ability to track down the exact queries casing performance
issues. Let's walk through a simple example.
Open SQL Server
Profiler, then open PerfMon by selecting Performance Monitor from the
Tools menu. (These first few steps are in no particular order; you just
need to make sure you have PerfMon and Profiler running concurrently so
you can correlate the results.)
Now you need to create a
new counter log in PerfMon. Expand Performance Logs and Alerts,
right-click Counter Logs, and select New Log Settings from the context
menu. Give the log a name, such as Perfmon_Profiler_Demo and select OK.
Now you can add counters
to the new log. Select the Add Counters button and make sure % Processor
Time is highlighted in the Counters list and click Add. Click Close to
return to the New Log dialog box. Take note of where the log file is
located. You will need this later when you import the log into Profiler.
The next thing you need to do
is start a new Profiler trace by selecting New Trace from the File menu.
Connect to a SQL instance, select the Standard (default) template, and
click Run to start the trace. Now that you have both traces running, you
need to generate some load on the server. Execute the script in Listing 1 to simulate a bad query.
Example 1. Query to Cause Performance Spike
SELECT * FROM sys.messages
CROSS JOIN sys.messages B
WHERE B.language_id = 1033 AND
 B.text like '%Warning%' AND
 B.text like '%instance%'
|
Before you can correlate the
two traces, you have to stop, save, and reopen your Profiler trace, and
then stop your PerfMon counter log. Stop the Profiler trace and select
Save As => Trace File from the File menu to save the trace. Now reopen the trace by selecting Open =>
Trace File from the File menu. This is a good time to stop your PerfMon
trace as well. Return to PerfMon, highlight the new log you created,
and select Stop from the menu.
Now you have a new option
available in SQL Server Profiler under the File menu called Import
Performance Data. Select Import Performance Data and browse to the
location of your PerfMon log file to import it into Profiler. This will
open the Performance Counters Limit dialog box so you can select which
counters you would like to import into Profiler. Make sure % Processor
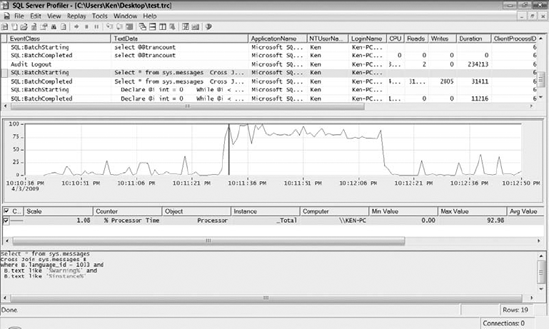
Time is selected, and click OK. You can now select a point on the
PerfMon trace, and Profiler will take you to the query that was
executing at that point. As you can see in Figure 1, the query in Listing 1 was the cause of the spike in PerfMon.