The metrics necessary to understand
how your server is performing can be grouped into four basic areas:
memory, central processing unit (CPU), disk input/output (I/O), and
network. When your server is running slowly, one of these four elements
needs tuning. To gather the information about these processes, and many
more besides, the Windows operating system exposes what are called performance counters
for your use. There are three ways to look at performance counters:
using the Performance Monitor utility, using DMOs, and using the Data
Collector.
1. Understanding Performance Counters
Before getting into the methods to look at
performance counters, we’ll discuss which performance counters are most
useful to you. When you see the list of available performance counters,
you’re likely to be overwhelmed. Table 1
describes the most commonly used and useful performance counters, what
they measure, and what represents potentially problematic measurement.
Performance counters are grouped together by what are referred to as objects. Objects may have a particular application called an instance. Under this are the actual counters. To present the information, the Object(Instance):Counter format is usually used.
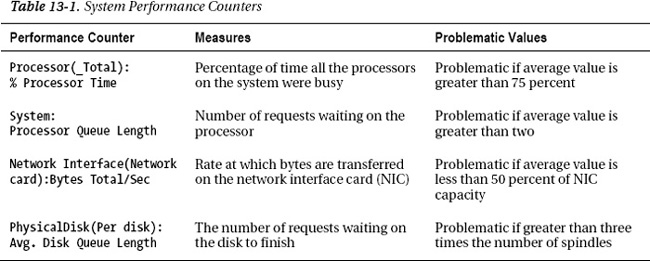
These basic counters will show you the amount
of time that the various system processes are spending working on your
system. With the queue length of the processor and the disk, you can
see whether some processes are waiting on others to complete. Knowing
that a process is waiting for resources is one of the best indications
you’ll get that there is a performance problem. You can also look at
the amount of information being sent over your network interface card
(NIC) as a general measure of problems on your network. Just these few
simple counters can show you how the server is performing.
To use these counters, you need a general idea of what constitutes a potential problem. For example, % Processor Time
is problematic when a sustained load is 75 percent or greater. But you
will see occasional spikes of 100 percent. Spikes of this nature are a
problem only when you also begin to see the Processor Queue Length
value grow. Understanding that the Average Disk Queue Length value is
growing will alert you to potential problems with I/O, but it will also
let you know that your system is beginning to scale and that you may
need to consider more, or different, disks and disk configurations.
Several counters will show you the performance
and behavior of SQL Server itself. These are available in the same
places as the system counters, but as you’ll see in Table 2, they are formatted slightly differently. You’ll see these as SQL Server:Object(Instance):Counter.
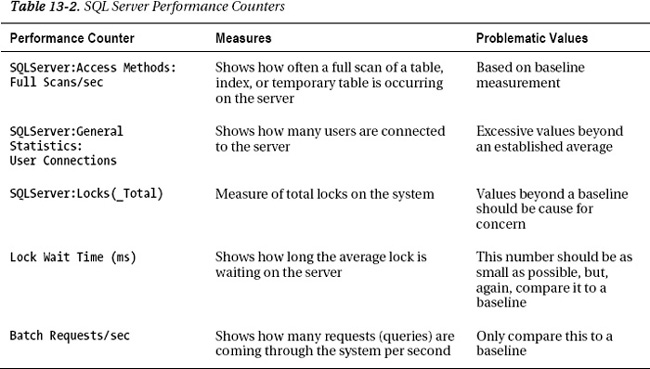
The first counter listed in Table 2, Full Scans/sec, lets you know how many full scans
(a complete read of an index or a table row by row) the system is
experiencing. Large numbers here indicate poorly written queries or
missing indexes. The second counter, User Connections, simply shows the
number of user connections in the system. This is useful when combined
with other measures to see how the server is behaving. Lock Wait Time
is an indication that a lot of activity is occurring on the server and
processes are holding locks that are necessary to manipulate data. This
may suggest that transactions are running slowly. Finally, the counter Batch Requests/sec indicates just how much load the server is operating under by showing the number of requests in the system.
The counters displayed in Tables 1 and 2
are a very small subset of the total counters available, but these will
give you a general indication of the health of your server. You would
need to look at a number of other counters to get an accurate measure
of a system’s health. The counters mentioned here are the ones that are
most likely indicative of a problem on the system. The idea here is
that anything that is causing queuing, in other words, waits in the CPU
or I/O, is a problem that needs to be identified and dealt with. Within
SQL Server, growing numbers of scans or lock waits can also indicate
deteriorating performance. So, although these counters won’t provide an
overall health for the system, they do act like a check on the pulse of
the system, which is an early indicator of other problems. There are
multiple ways to access these counters on your systems.