Start by adding to your project a data source view
(DSV) called CustomerProfitability that contains the
vCustomerProfitability view.
Important
Normally,
instead of using the vCustomerProfitability view in the DSV, you would
use the TrainingCustomers and TestCustomers tables that were created by
the SSIS package. Then you would use TrainingCustomers to train your
mining models. If we were to use the TrainingCustomers table now,
however, the results of the mining models would be not quite the same as
those shown in the figures. The Percentage Sampling Task generates random
samples, making the results slightly different from those presented in
this chapter. Using vCustomerProfitability, which includes all
customers, makes the examples in this chapter completely reproducible. |
For the customer
profitability analysis, we want to find out the common characteristics
of high-profit and low-profit customers. To do this, we must add a
calculated column to our DSV that defines “high profit.” We don’t want
to store this in our database because it is a definition specific to the
analysis we are doing.
To create a calculated column in the DSV, take the following steps:
1. | Right-click the vCustomerProfitability view on the DSV design tab and choose New Named Calculation.
|
2. | In the Named Calculation dialog box, give your named calculation the name ProfitCategory, enter the description High-profit customers in the top quartile of profit, and type the following in the Expression box:
CASE
  WHEN Profit>1077 THEN 'High'
  ELSE 'Low'
END
This creates two categories of customers: the “High” category for
customers in the top quartile of profit amounts and the “Low” category
for all other customers.
|
3. | Click OK. You will see your newly created column in the DSV with a calculator icon to the left of it.
|
Now we’ll browse the data within the DSV:
1. | Right-click vCustomerProfitability and choose Explore Data. The Data Explorer window opens.
You can choose to view either the top x rows in your table or a random sample of x rows from your table. (The value of x
is configurable.) By default, the Data Explorer window shows data for
the top 5000 rows in your data source (the exact meaning of “top” will
vary, depending on how the data is sorted in your table).
|
2. | To
change this default, click the Sampling Options button (the one with
the properties icon) in the upper-right corner of the window. This opens
the Data Exploration Options dialog box.
|
3. | Click the Random Sample option button, leaving the Sample Count at 5000, and click OK.
|
4. | To
implement this configuration change and see the data for your random
sample of records from vCustomerProfitability, you must refresh the
data. To do so, click the Resample Data button (the one with the refresh
icon) in the upper-right corner of the Data Explorer window.
Now scroll to the rightmost column of the table. You will see the
named calculation you just created. It will look no different from any
other column of your table.
|
Using the other tabs in the
Data Explorer window, you can create PivotTables and charts or simple
data distribution charts. To use the distribution chart feature, follow
these steps:
1. | Click the Chart tab.
By default, column charts are displayed for a subset of the
columns in your DSV. You can click anywhere on the drop-down control at
the top of the window to modify the view to display charts for any
combination of columns from your table.
|
2. | Select
the ProfitCategory column from the drop-down list, and either press
ENTER or click the Chart tab—or click somewhere in the chart area—to
dismiss the column list. A column chart for Profit Category should
appear alongside the other charts.
|
3. | You
can change the chart type to a (horizontal) bar chart or pie chart. To
change your column charts to pie charts, click the pie chart button in
the upper-left corner of the Data Explorer window, or right-click a
blank area of the chart and choose Pie Chart. Figure 1 shows pie charts of several customer characteristics.
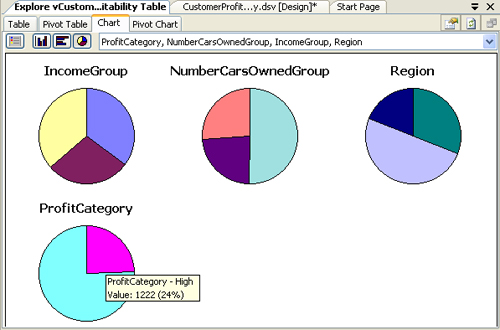
|
You can see details
about the data represented by a particular item on the Chart tab by
hovering the mouse pointer over the item. For example, hovering over a
pie slice shows you the count and percentage of records that are
represented by that slice (as shown in Figure 20-9).
Data
Explorer allows you to see the distribution of your data quickly and
easily without your needing to write a single line of code. This can be
useful during the startup phase of your data mining project, before any
models have been created.
Creating a Mining Structure
Mining models in SSAS are contained within mining structures.
A mining structure consists of a subset of columns from your DSV and
one or more mining models that use the columns. The content type of each
column is set separately by the mining model—for each mining model in
your mining structure, you specify whether the column is a key, an
input, or a predictable column. (We’ll discuss the content types in more
detail later.)
Because you can also
indicate that a column in the structure should be ignored for a
particular mining model, you can conceivably have two mining models
within the same structure that do not share any input or predictable
columns. But it makes more sense to group, under the same structure,
mining models that answer the same business question and that have some
commonality in columns from your DSV. This is because mining models
created within the same structure can be compared using the Mining
Accuracy Chart functionality of SSAS, which we will examine shortly.
Furthermore, mining models that share a structure are processed in
parallel, with a single pass through the data.
Getting back to our data
mining goals, we want to know whether particular characteristics or
buying behaviors can help us predict who the high-profit customers are.
We also want to cluster customers according to their demographic
characteristics and buying behaviors. To that end, we will use the Data
Mining Editor in Visual Studio to create a mining structure with models
that use the Clustering, Decision Tree, and Naïve Bayes algorithms.
(Later we will discuss how each of these algorithms works, how they
differ from each other, and their appropriate use for specific
prediction scenarios.)