Measures and dimensions
define what a cube can show you, giving you insight into, for example,
your business’s performance, your site’s Web traffic, or your clinical
experiment’s findings. You can run an MDX query and look at a measure’s
value over some slice of your cube, and because you’re familiar with its
measures and dimensions, you can decide if the values meet, exceed, or
fall short of your goals or your expectations. With the help of key
performance indicators (KPIs) in Analysis Services 2005, you can now
embed that goal criteria in the cube rather than evaluate it in your
head or in your application.
KPIs
simply consist of a set of MDX-based conditional expressions, stored on
the server, that return numeric values indicating the performance of a
measure, a calculated measure, or a calculated expression over a slice
of the cube and/or the relative performance of that value over a period
of time. KPIs are associated with certain predefined icon sets,
providing a visualization tool (even if a crude one) over your measures
and an easy way for your users to get up to speed quickly on what the
measures data are telling you.
Pay attention here
because this is the stuff that’s currently hot in the market: KPIs
enable what are known in the BI and business performance management
(BPM) worlds as scorecards,
and they lend themselves extremely well to dashboard-type user
interfaces.
More Info
Microsoft’s
Business Scorecard Manager product, which works in tandem with Analysis
Services, provides a Microsoft SharePoint–based platform for delivering
scorecards and KPI data to end users. |
Let’s set up a KPI and then
look at it in the special KPI browser view. Unfortunately, the cube’s
Browser tab will not display or allow querying of KPIs, but after
building and browsing our KPI we’ll address this shortcoming. We’ll do
so by making a short detour over to SQL Server Management Studio, where
we will query our KPI values using that application’s MDX Query window.
Click on the KPIs tab of
the cube designer, and then click the New KPI toolbar button (fourth
from the left) or choose the Cube/New KPI main menu option. You should
see a new KPI open in form view, which is quite similar to the
Calculations tab’s form view. The main, right-hand area of the tab
contains a field-oriented form for defining your KPI. A Calculation
Tools pane, identical to that of the Calculations tab, appears at the
lower left, and a KPI Organizer pane, similar to the Calculations tab’s
Script Organizer pane, appears at the upper left.
The form fields for a KPI
include its name, the measure group it is associated with, and MDX
expressions for the value to be tracked and a “goal” value for it. The
KPI value and goal value are purely numeric indicators that alone offer
little extra value over measures and calculated members.
KPI Visualization: Status and Trend
Extra value is provided, however, by MDX expressions for the KPI’s status and its trend.
The status expression returns a value, typically between –1 and +1,
indicating the relative health of the KPI value; the trend expression
returns a value, usually in the same range, indicating the increase or
decrease in status value relative to a prior period of time. Along with
the expressions themselves, you can also select associated indicator
graphics (icon sets).
A status or trend value
of +1 conveys a “good” state of affairs for whatever the KPI is meant to
monitor. A value of –1 is a “bad” value, and a value of 0 is “neutral.”
The icon sets selected for your status and trend expressions contain
several icons, each corresponding to a different discrete value returned
by the expression.
At a minimum, these
icons support the values of –1, 0, and 1. For example, a Traffic Light
graphic displays a red, yellow, or green light, respectively. Others,
such as a Gauge graphic, accommodate intermediate values, typically +.5
and –.5, which we might associate with “fair” and “substandard,”
respectively. These intermediate values (and the icons to which they correspond)
are relevant only for status; trend, by definition (by the Analysis
Services 2005 definition, anyway), is always positive, negative, or
neutral.
A Concrete KPI
This is all rather abstract, but it will become clear once we’ve a built a KPI and put it to use. Our KPI will be based on our Avg Total Sales measure. Configure the KPI you added earlier as follows:
1. | Set the Name to Average Total Sales KPI (no square brackets necessary).
|
2. | Select Main for Associated Measure Group.
|
3. | Set the Value Expression to [Measures].[Avg Total Sales].
(You might want to drag and drop the Measures\Main\Non-Sum\Avg Total
Sales node from the Metadata tab of the Calculation Tools pane onto the
Value Expression area rather than typing this manually.)
|
4. | Set the Goal Expression to 1500.
|
5. | Set the Status Indicator graphic to Gauge, if it has not been done already.
|
6. | Enter the MDX code in Listing 1
into the Status Expression area. (You might want to drag and drop items
from the KPI folder of the Functions tab in the Calculation Tools pane
to complete this step more easily.)
|
7. | Set the Trend Indicator to Standard Arrow, if it has not been done already.
|
8. | Set the Trend Expression to the contents of Listing 18-2 (using drag and drop from the Calculation Tools pane as appropriate).
|
Listing 1. Status expression MDX code for Average Total Sales KPI
CASE
    WHEN KPIVALUE("Average Total Sales KPI") /
 KPIGOAL("Average Total Sales KPI") >= .95 THEN
        1
    WHEN KPIVALUE("Average Total Sales KPI") / KPIGOAL("Average Total Sales KPI") <  .95
    AND
    KPIVALUE("Average Total Sales KPI") / KPIGOAL("Average Total Sales KPI") >= .85 THEN
        0
    ELSE
        -1
END
|
The MDX expression in Listing 1
determines actual average sales as a percentage of the Goal ($1500) and
maps as positive (+1) values that are 95 percent and up. Average Sales
greater or equal to 85 percent and less than 95 percent of goal are
neutral (0), and those below 85 percent are negative (–1).
Listing 2. Trend MDX expression code for Average Total Sales KPI
CASE
    WHEN ISEMPTY(( [Measures].[Avg Total Sales],
    [Order Date].[Year -  Quarter -  Month -  Date].PREVMEMBER)) THEN
        NULL
    WHEN [Measures].[Avg Total Sales] < ([Measures].[Avg Total Sales],
    [Order Date].[Year -  Quarter -  Month -  Date].PREVMEMBER) THEN
        -1
    WHEN [Measures].[Avg Total Sales] = ([Measures].[Avg Total Sales],
    [Order Date].[Year -  Quarter -  Month -  Date].PREVMEMBER) THEN
        0
    ELSE
        1
END
|
The MDX expression in Listing 2 uses the PREVMEMBER property of our Order Date dimension’s hierarchy to compare Adjusted Sales Growth
for the period and level for which the KPI is being evaluated and
compares it to the previous period’s value. If the previous period’s
value is lower, growth is positive and the trend expression returns a
value of +1; if the value is higher, growth is negative and a value of
–1 is returned. If the two values are equal, growth is flat and a value
of 0 is returned.
Note
In
reality, comparing the difference between the two periods’ values and
returning 0 for a range of values from slightly below 0 to slightly
above 0 might be a better determinant of flat growth, but for the
purposes of this exercise, we’ll stick with a difference of 0. |
Click the down arrow
icon next to the Additional Properties header to expand that section of
the form. We won’t enter values for all the fields here, but it’s
important to know the available options. Display folders for KPIs work
similarly to the way they do for measures, calculations, and
hierarchies, allowing you to group KPIs by category. You can enter
multiple folder names, thus allowing your KPIs to appear under more than
one folder, if you separate them with a semicolon.
A parent KPI allows you
to organize your KPIs hierarchically and establishes a calculation
relationship whereby the parent KPI’s value is determined by that of its
children. The relative contribution of each child KPI’s value to that
of its parent is determined by the value entered in the Weight field. In
the Current Time Member field, you can specify an exclusive time period
within which the KPI is valid. You must specify a member of a time
dimension defined for the measure group with which the KPI is
associated.
Note
When
you enter values for a KPI’s fields, remember that the Value
Expression, Goal Expression, Status Expression, Trend Expression,
Weight, and Current Time Member field values are full-fledged MDX
expressions, supporting all MDX language constructs, word completion,
member listing, “squiggle” syntax error prompting, and entry of
comments. |
Finally,
the Description field allows you to document your KPI by storing a
descriptive string of text about it in the cube itself. This text is
retrievable by client applications, which, again, makes it easier for
users to browse your cube. Go ahead and type Monitors health of average total sales in the Description field for our KPI and leave the other fields in the Additional Properties section blank.
Now that we have
completed the definition of our KPI, it’s time to test it, but our
testing method will be different than for other elements in our cube.
We’ll cover those differences in a minute, but first save and deploy
your changes and make sure you do so while the KPI’s tab is visible.
After the deployment, notice that the KPI tab has switched from form
view to browser view.
Testing KPIs in Browser View
The Browser View
toolbar button is now selected, and form fields have disappeared, giving
way to a new window. In the upper pane of this window you can specify a
slice of your cube for which to view the KPI data; the lower pane
displays your KPI data. This data includes the value for the current
slice, the goal value, graphical depictions of the status and trend
values, and the weight value. An information icon also appears; you can
hover your mouse pointer over it to display the KPI’s description in a
ToolTip.
The KPI browser view
provides an easy way for you to view KPI values for specific dimensional
subsections (slices) of your cube. However, by default, the browser
displays aggregated KPI data for the entire cube, which is almost
meaningless. Narrowing down that scope requires making specific
selections in the filter pane. For example, we can look at the KPI data
for Brazil in the fourth quarter of 1996 by making the following
selections in the filter pane. (You might need to first reconnect in
order to be allowed to make these selections.)
| Dimension | Hierarchy | Operator | Filter Expression |
|---|
| Order Date | Year - Quarter - Month - Date | Equal | {Quarter 4, 1996} |
| Geography | Country | Equal | {Brazil} |
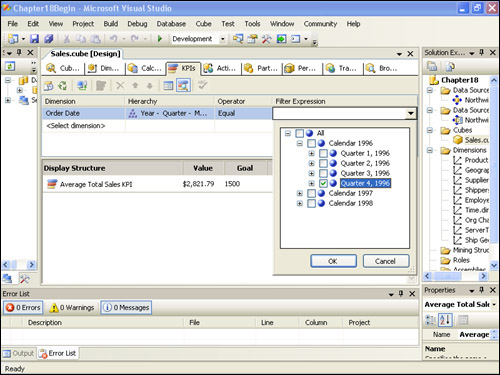
For Filter Expression,
you must click the drop-down arrow at the right edge of the column.
Then, in the dimension browser popup window, drill down to the member
you’re interested in, click its check box, and then click OK. The
necessary selection state for the {Quarter 4, 1996} member of the Order Date dimension is shown in Figure 1.
After you specify
your cube slice, click off the selected cell in the filter expression
table (for example, click anywhere in the lower pane) to force the new
KPI data to load and display.
Interpreting Results and Modifying the Slicer
When you’ve completed the previous steps, the KPI browser view should appear as shown in Figure 2.
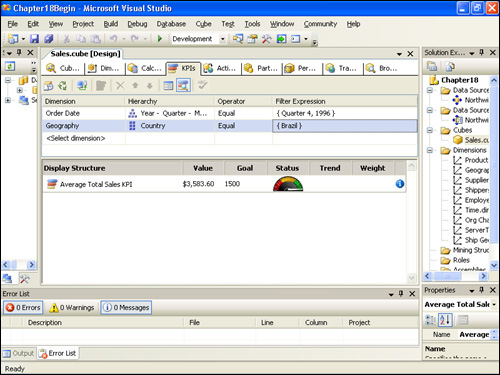
Notice
that the Value column displays $3583.60, which is well above goal.
Accordingly, the Status column’s graphic displays a full green
(indicating a status value of +1). The Trend column displays no graphic
at all. This results from a value of NULL
being returned by the trend formula because of an anomaly in the way
the KPI browser filters its data. Shortly, we will bring back KPI data
through an MDX query to obtain the correct value for the trend.
Now try changing the country to UK. (Remember to uncheck
Brazil before clicking OK.) You should see the KPI value decrease to
$1082.23 and the Status column graphic indicate red, which is correct
given that this value is less than 85 percent of goal ($1500). Next,
change the Order Date filter expression to {Calendar 1997} and the Geography filter expression to {Brazil, Canada}. (Again, remember to uncheck
the old filter member—UK—before clicking OK.) You should see the KPI
value increase to $1420.01 and the Status column graphic indicate
yellow, which is correct given that this value is about 94.7 percent of
goal and our range for yellow (status formula value of 0) is between
greater than or equal to 85 percent and less than 95 percent.